Smart Money
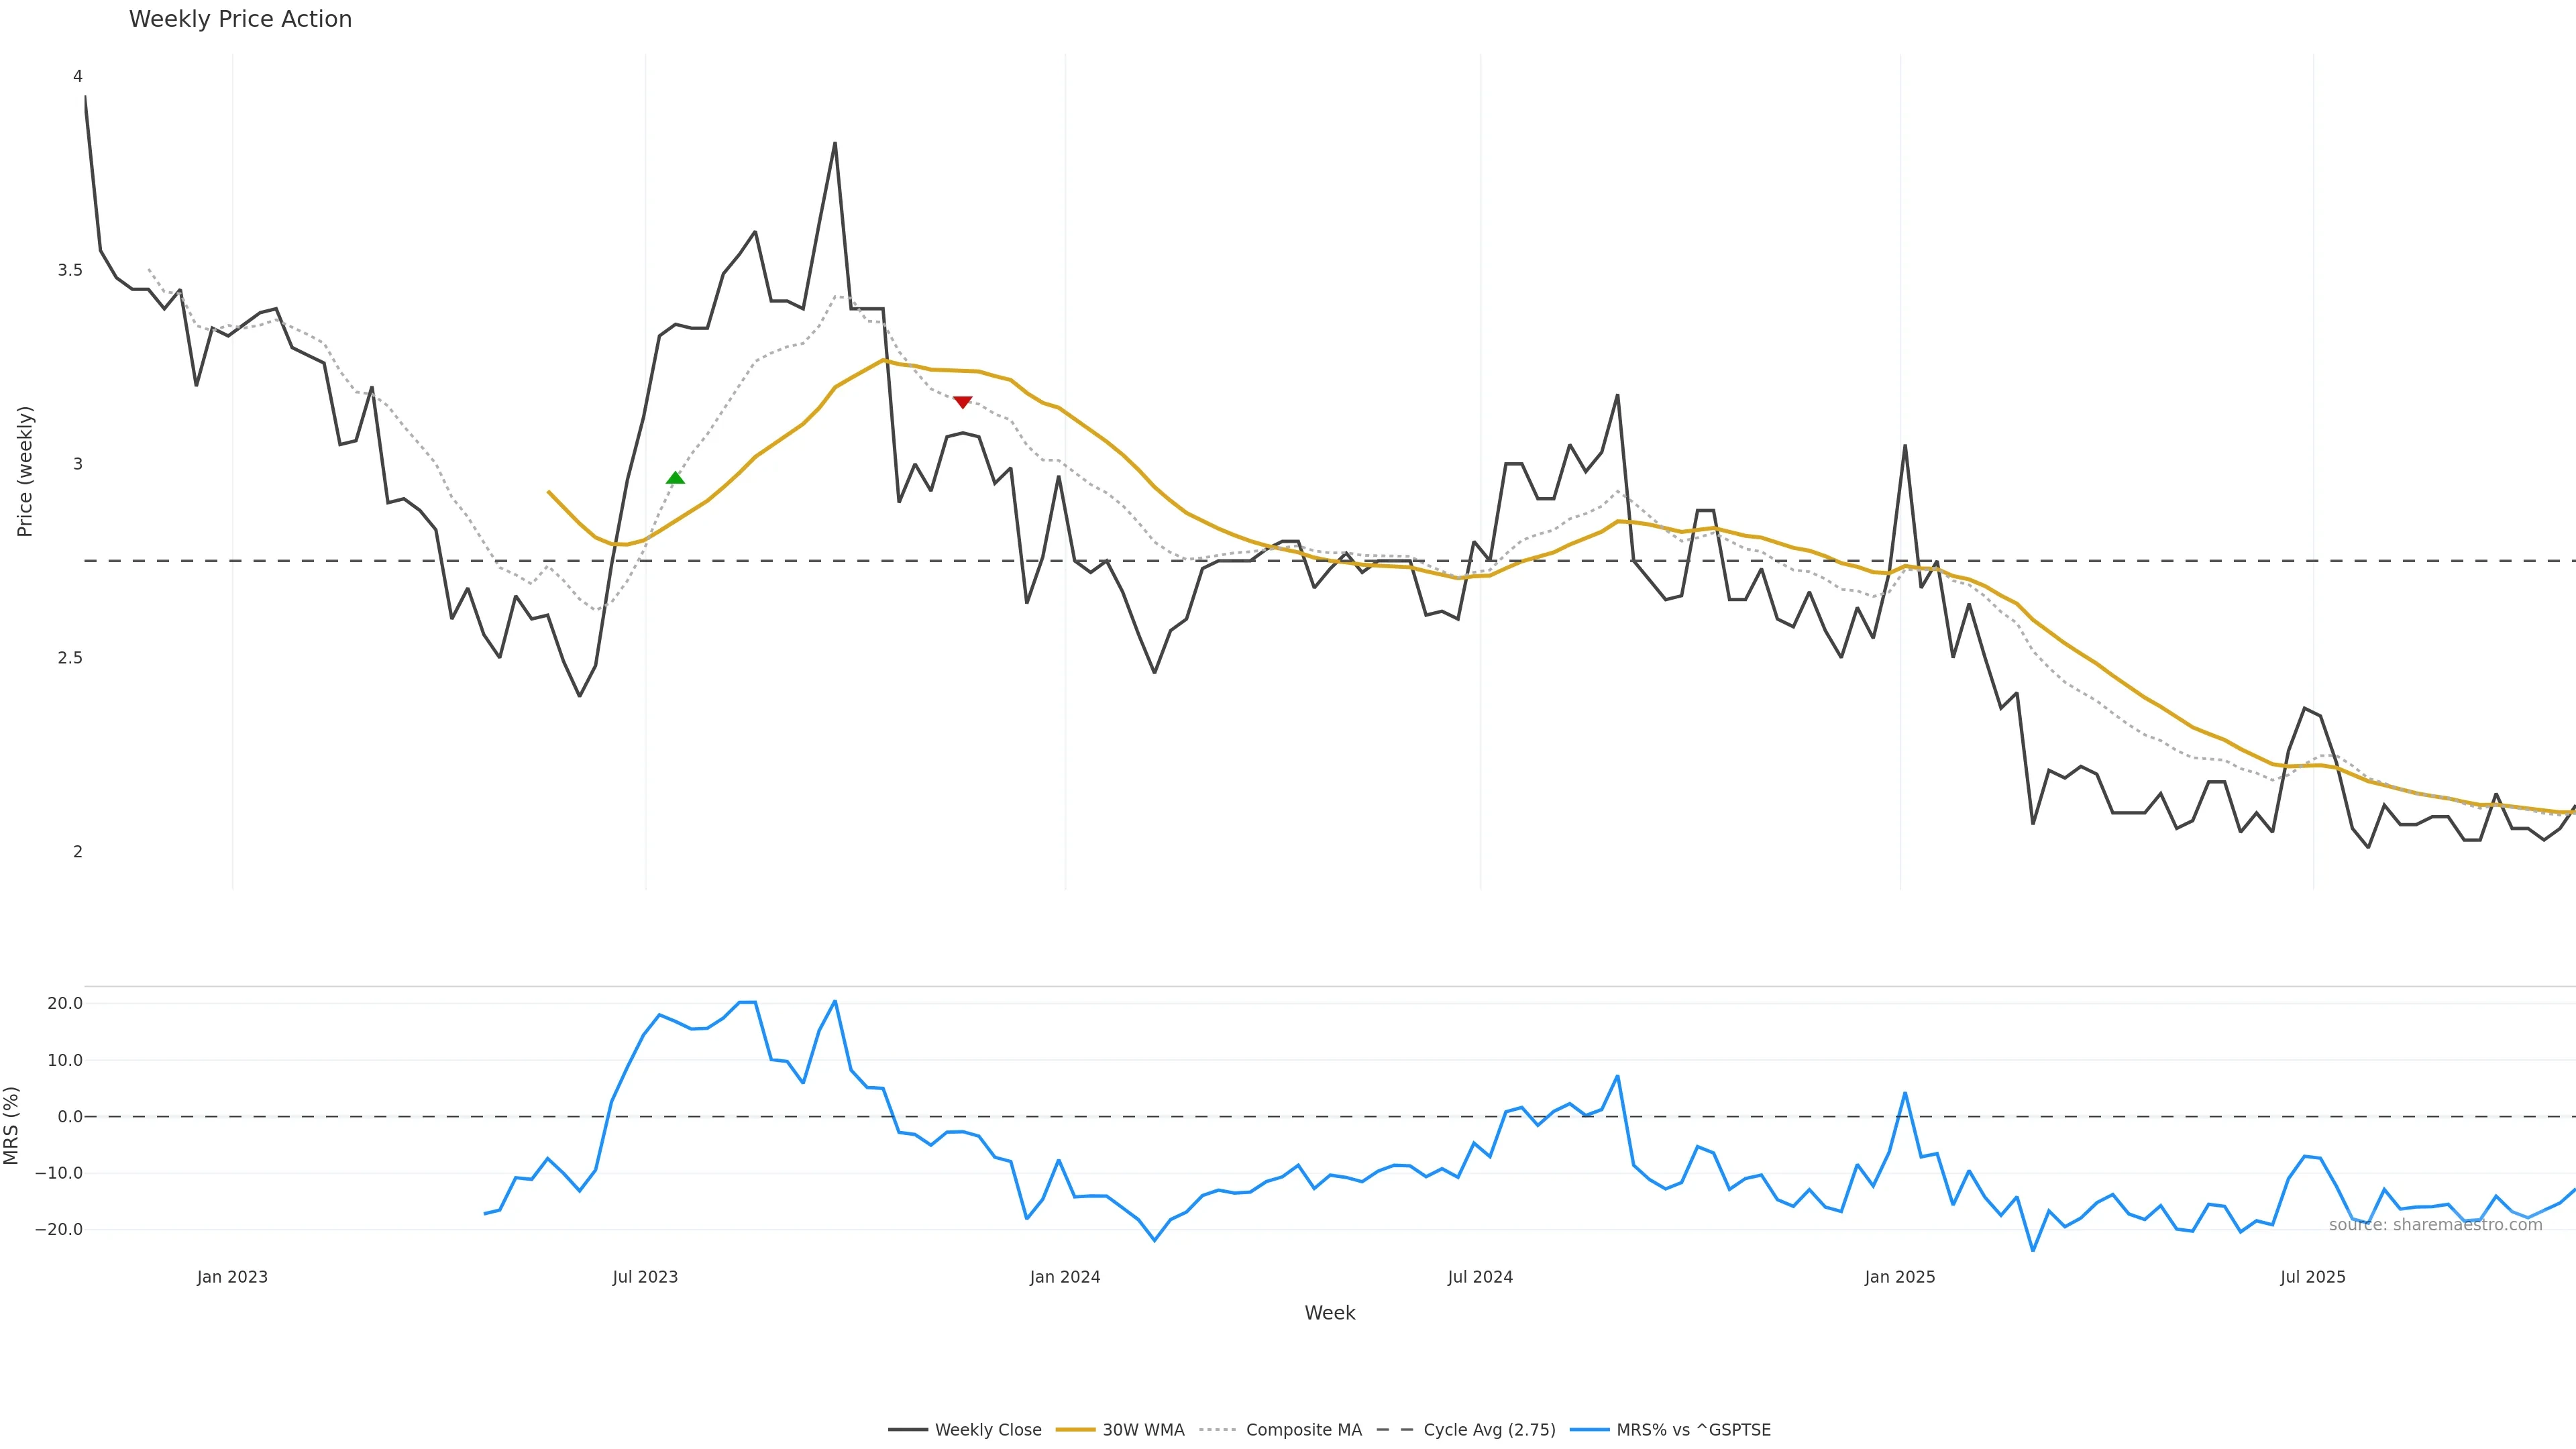
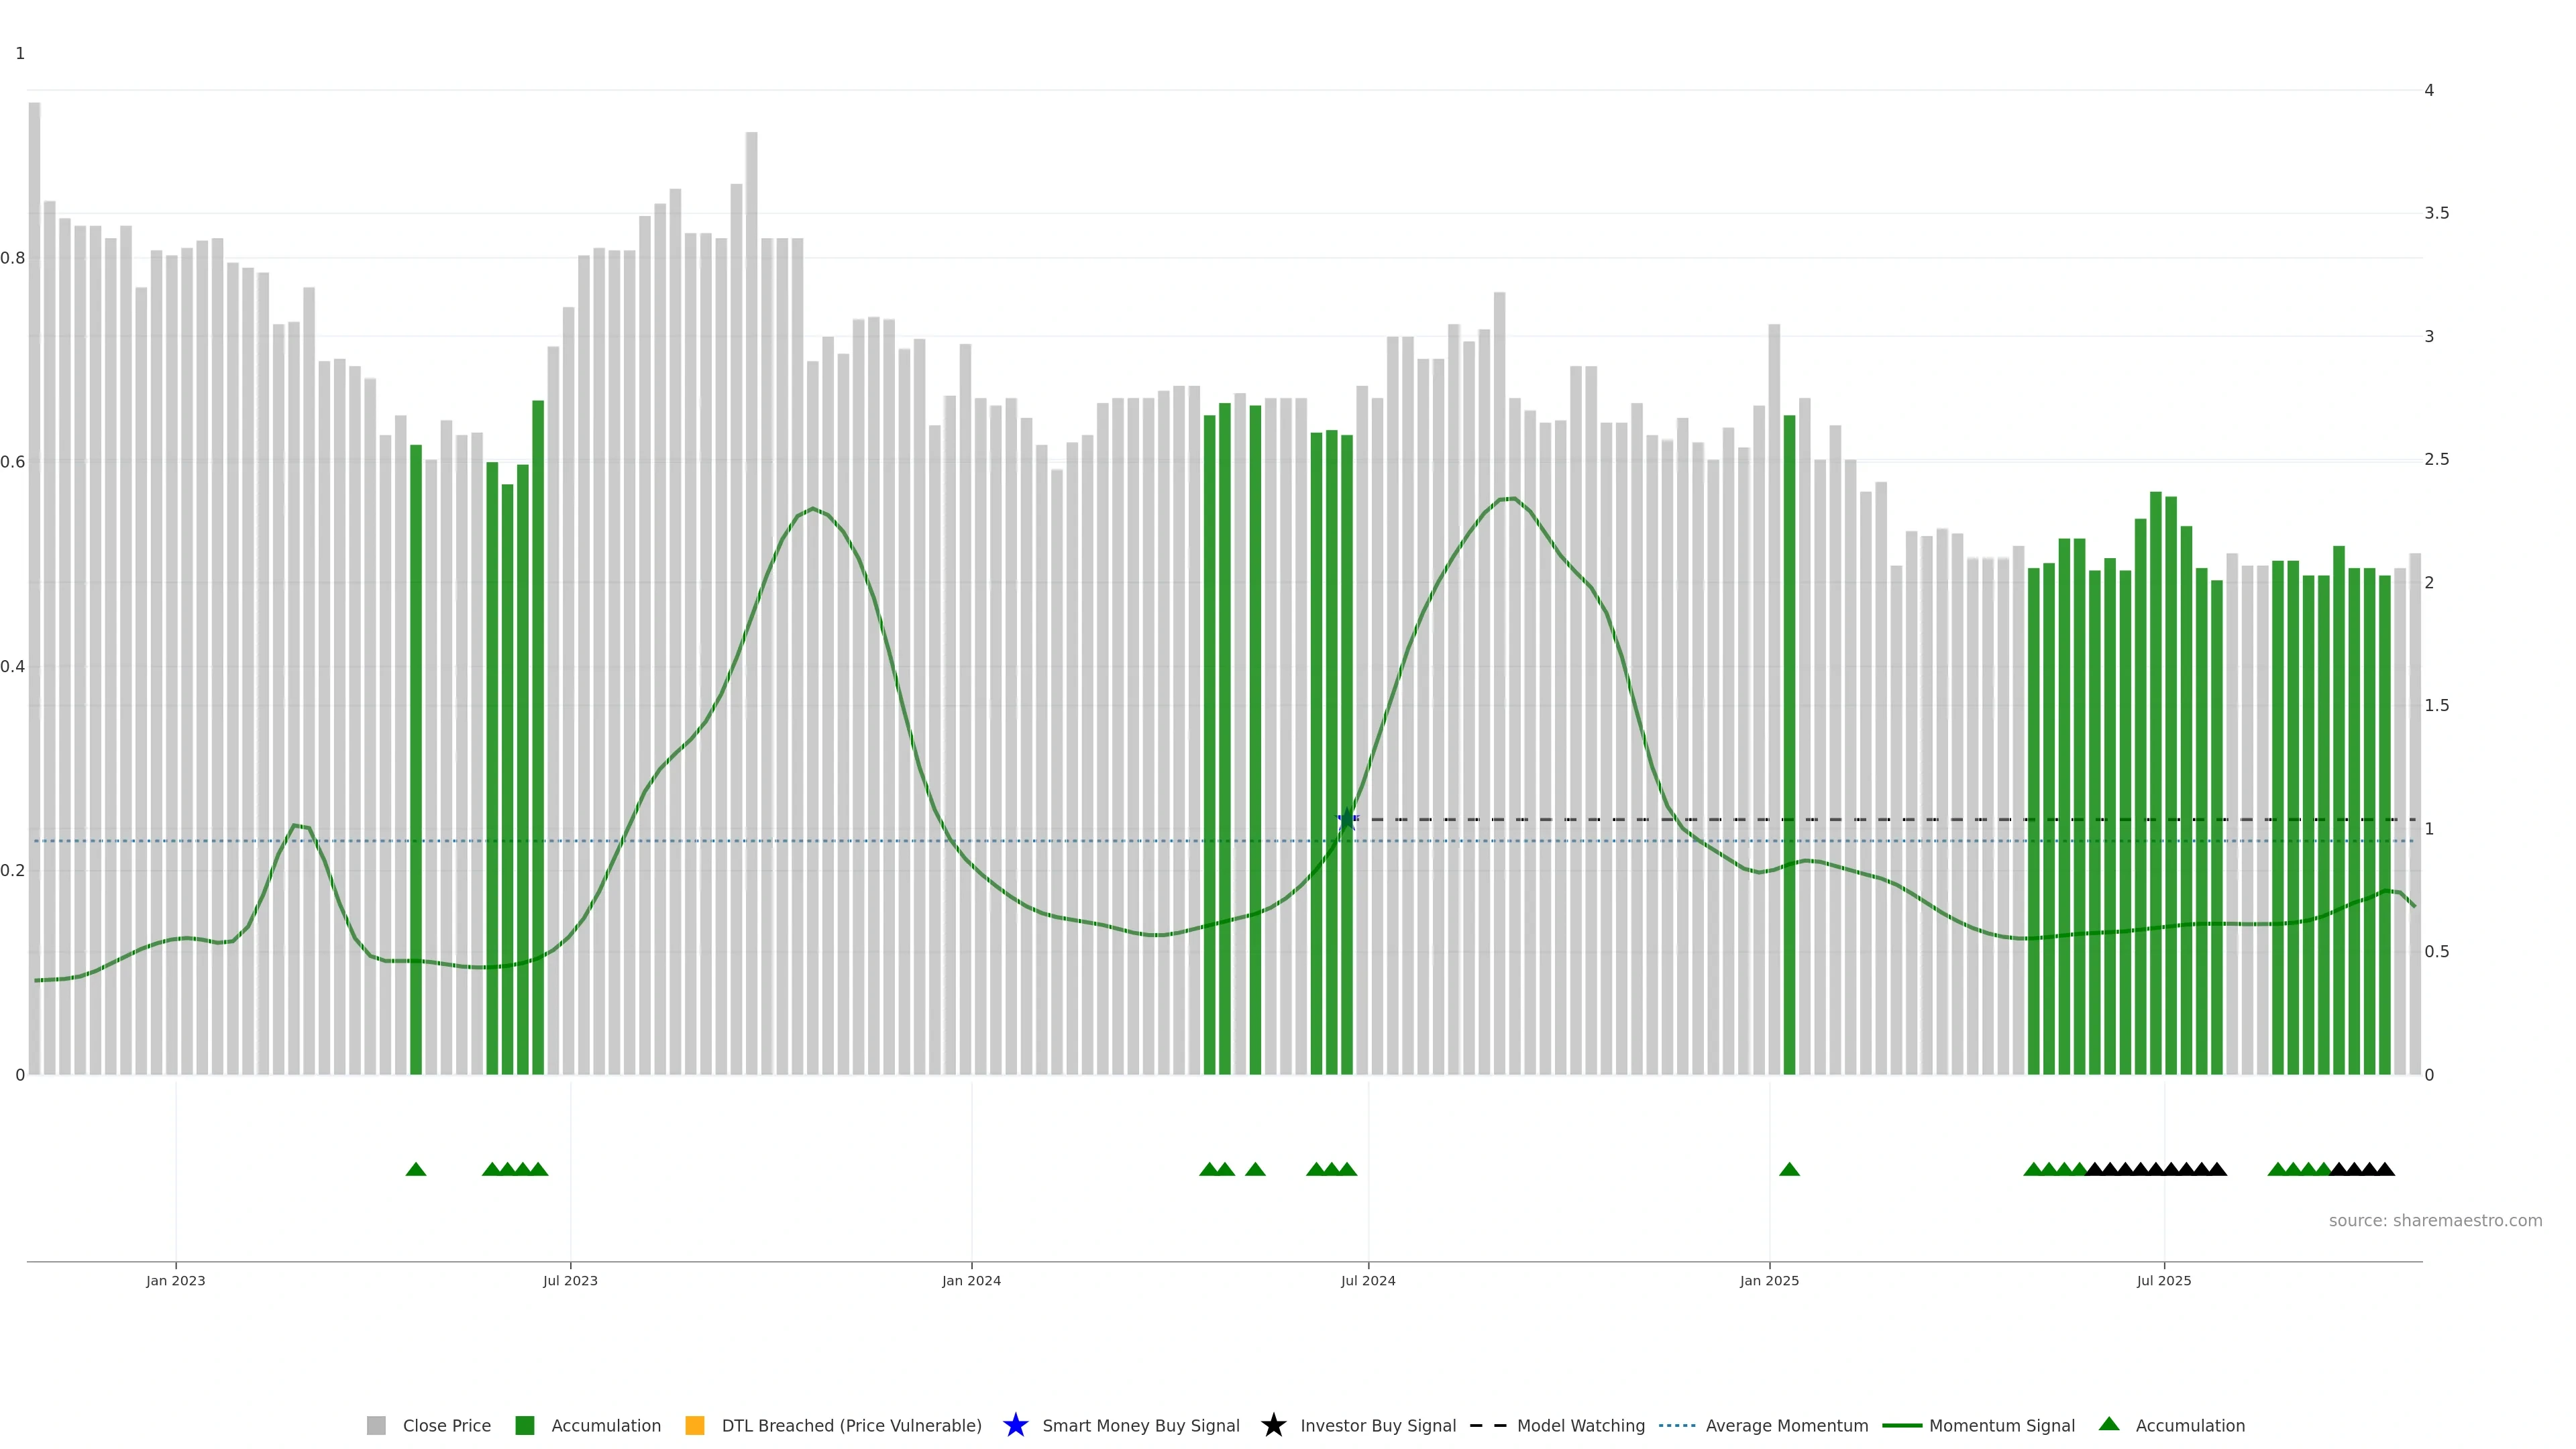
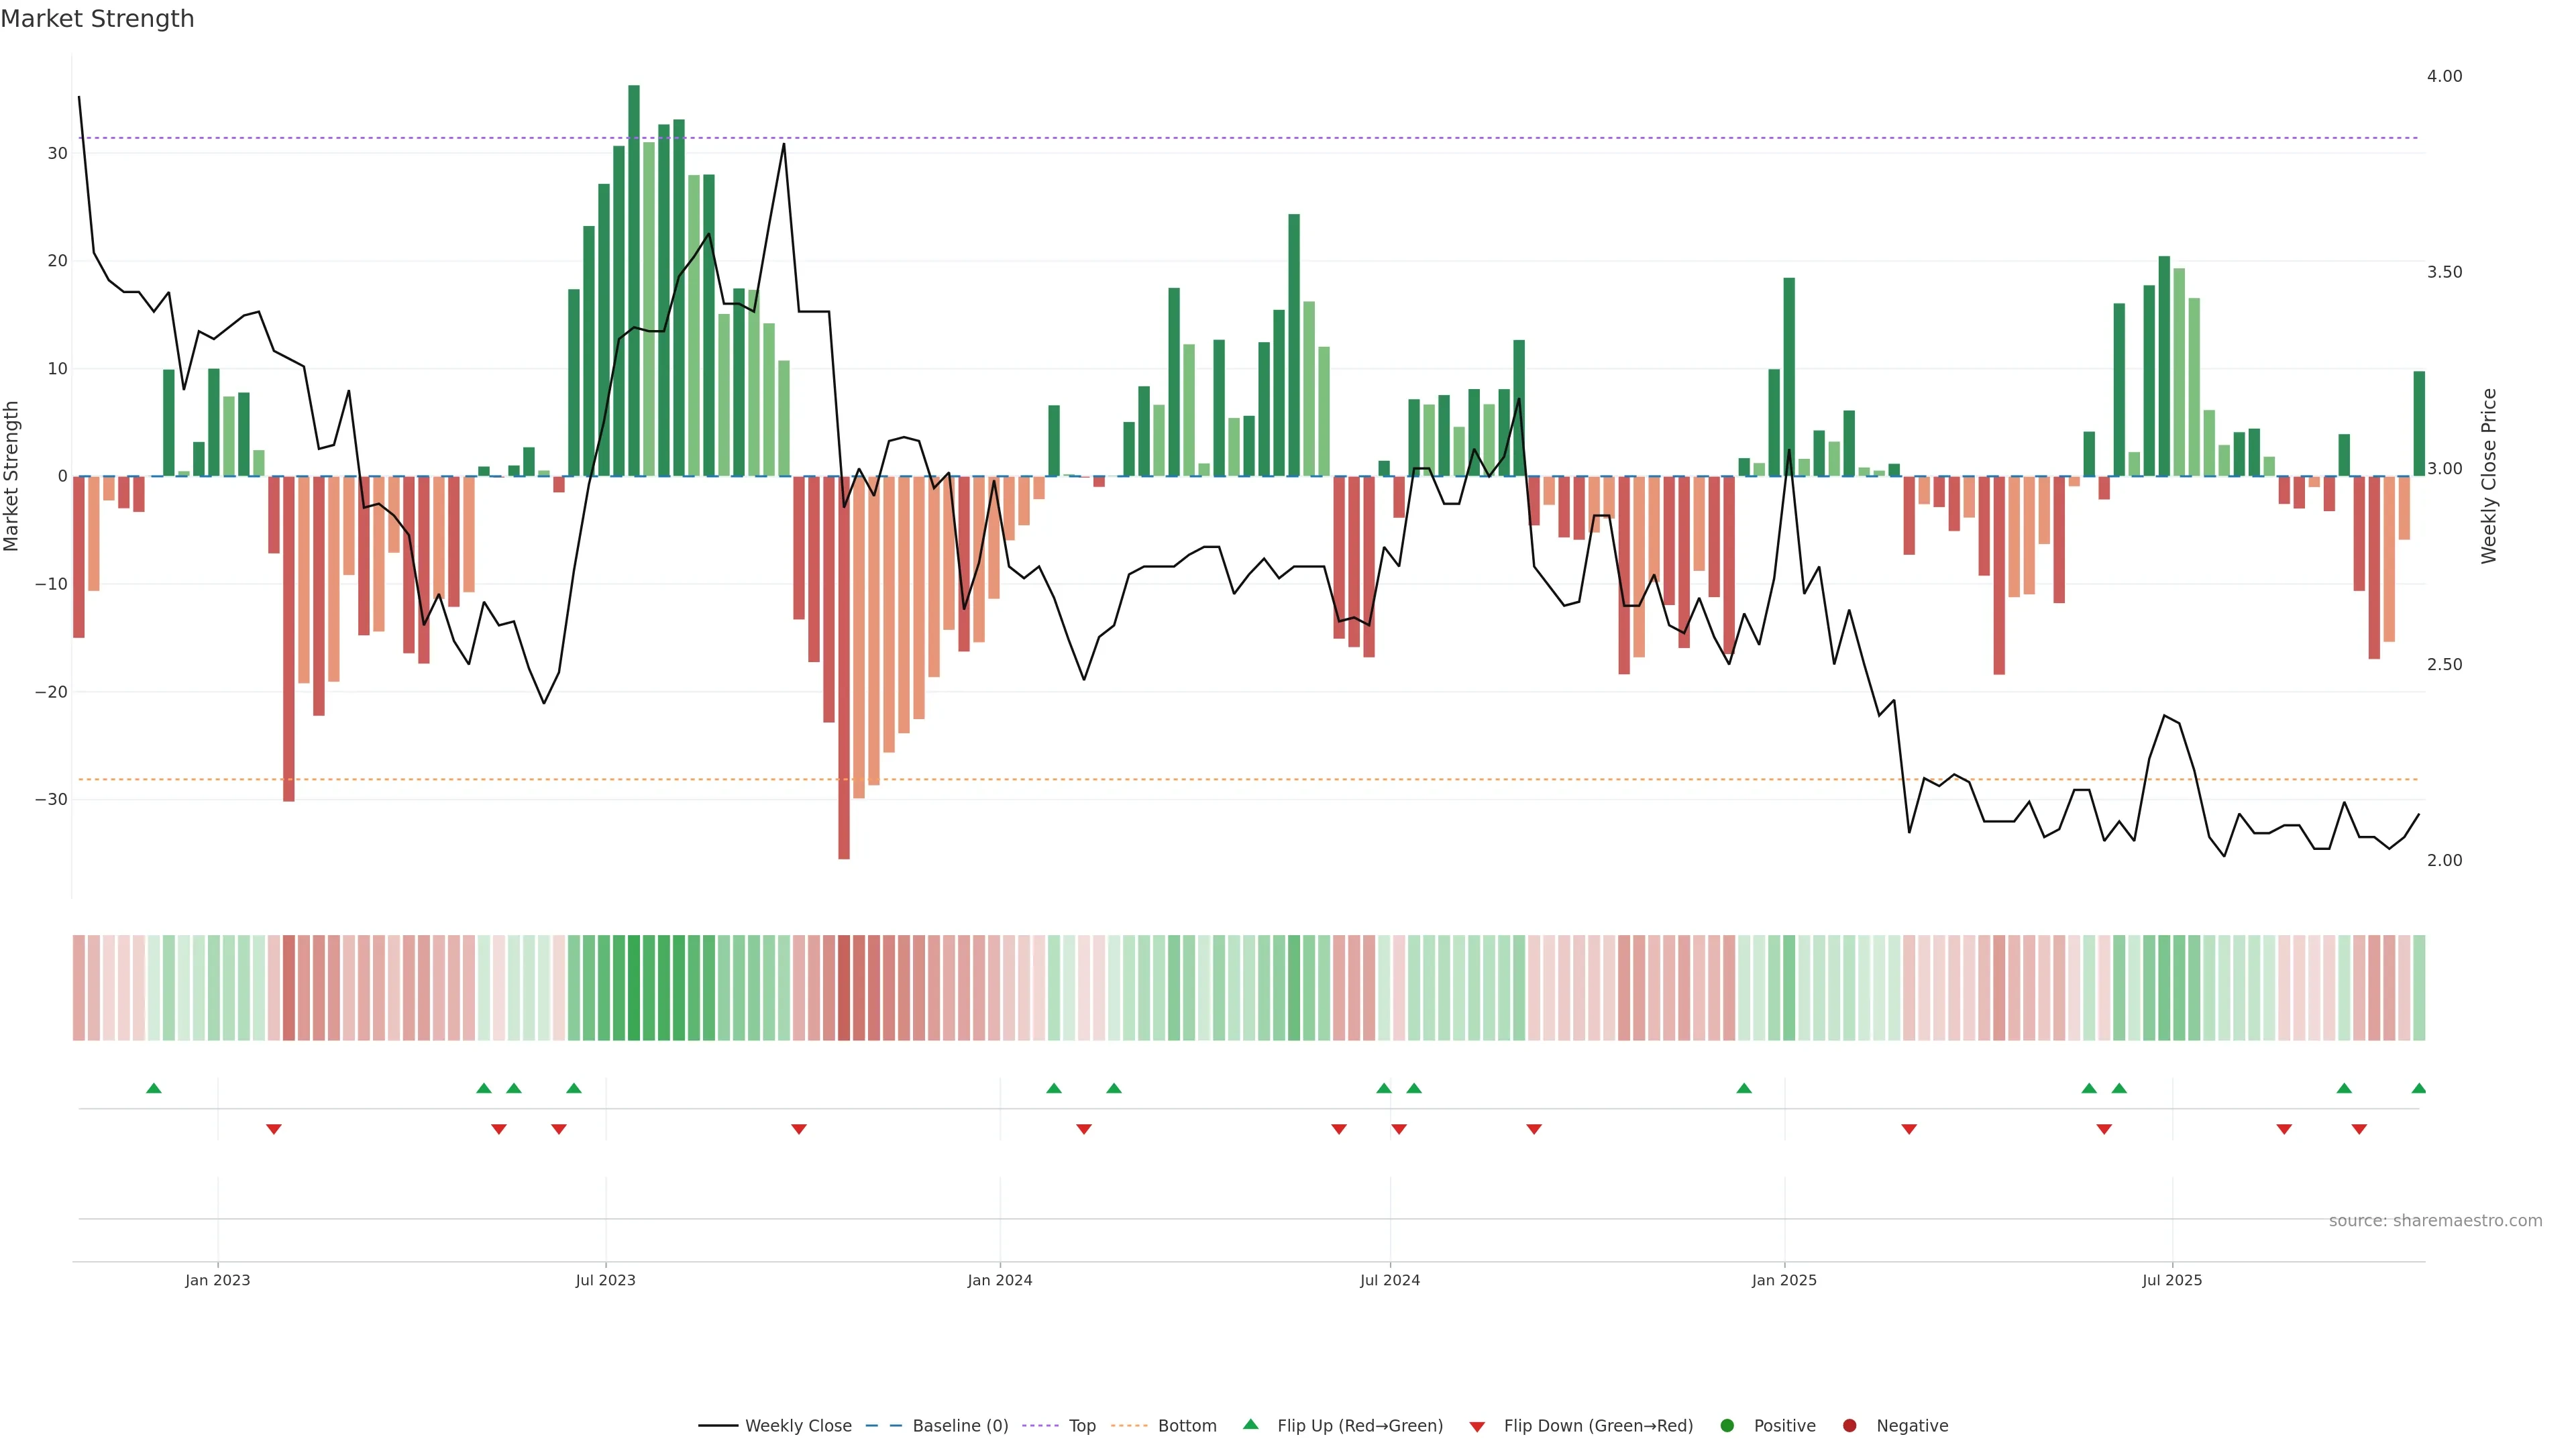
Early accumulation: trend rising from a depressed zone while pressure is sub-zero. — Often precedes Smart-Money style entries.
Score 0.75
+1 / -0
Early accumulation: trend rising from a depressed zone while pressure is sub-zero.
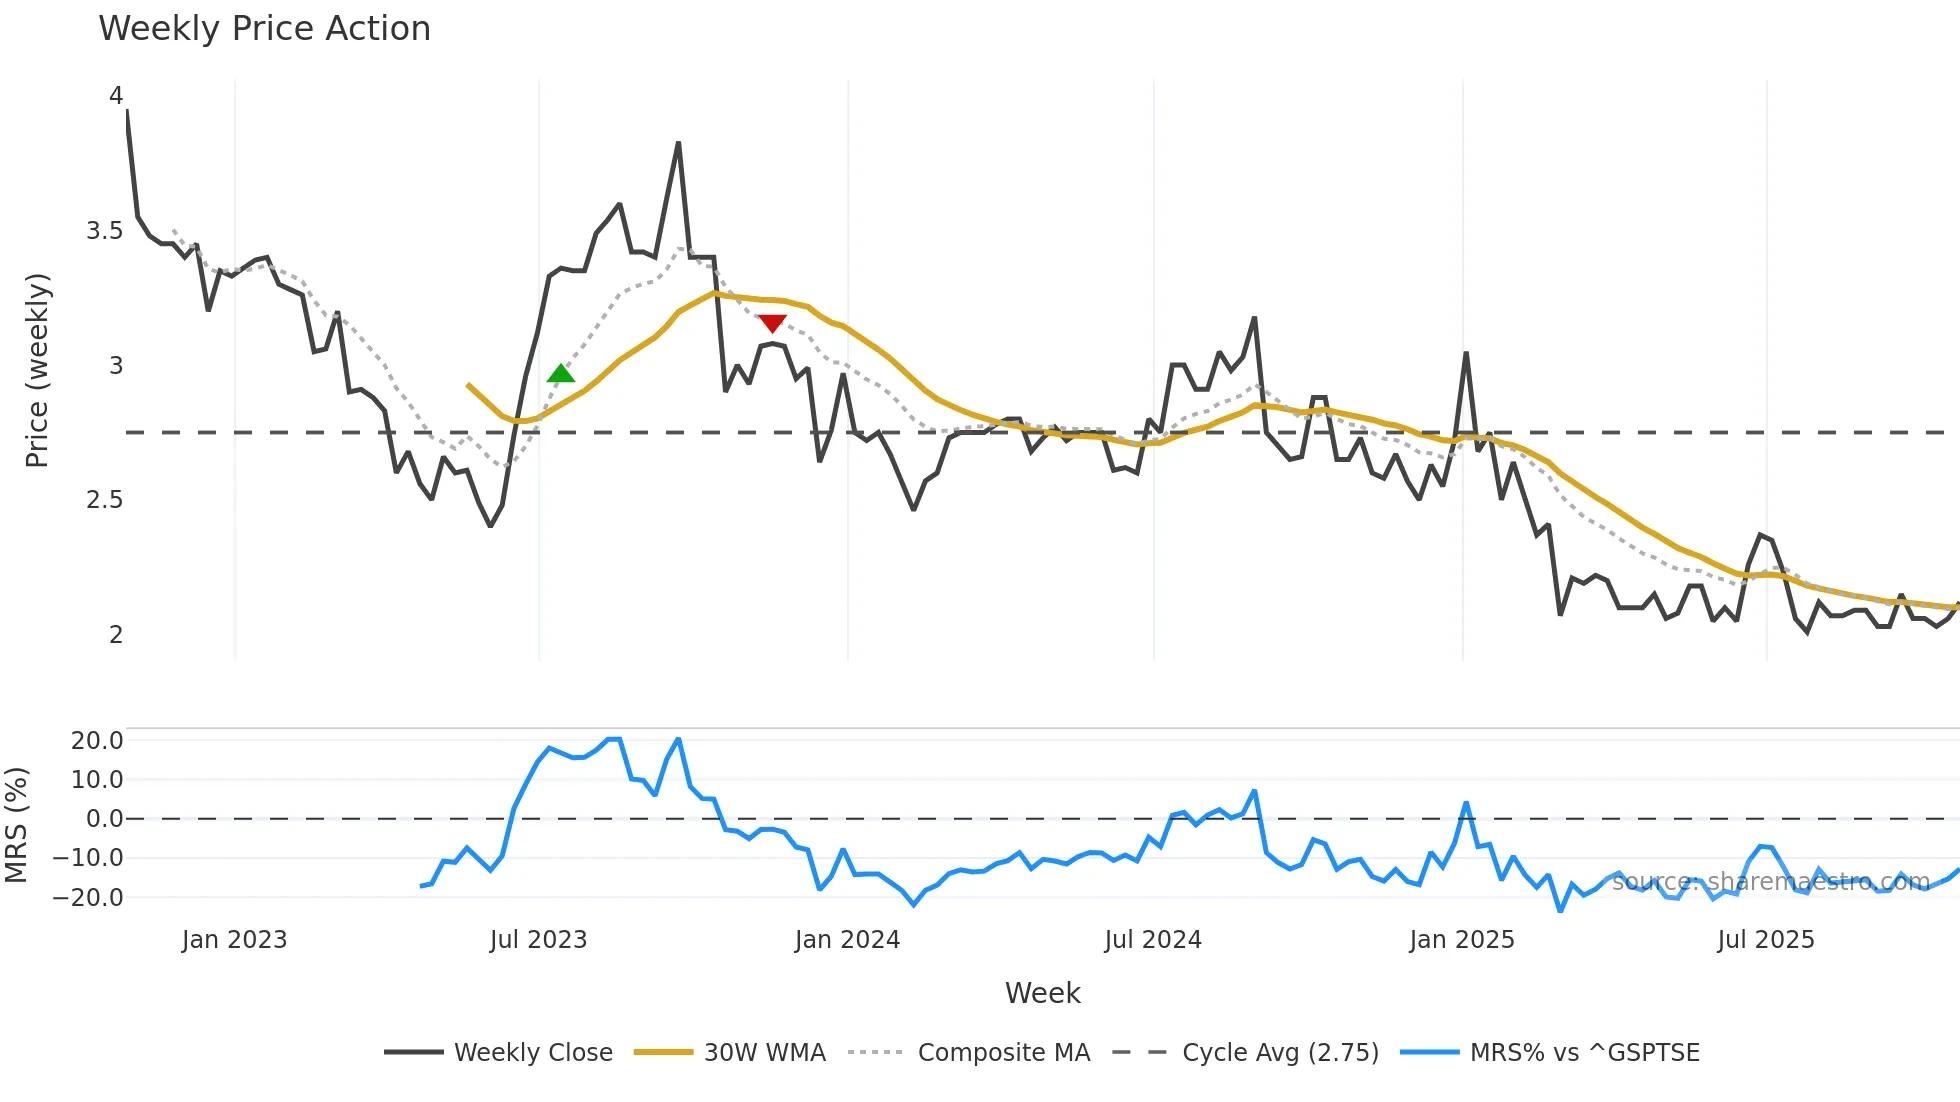
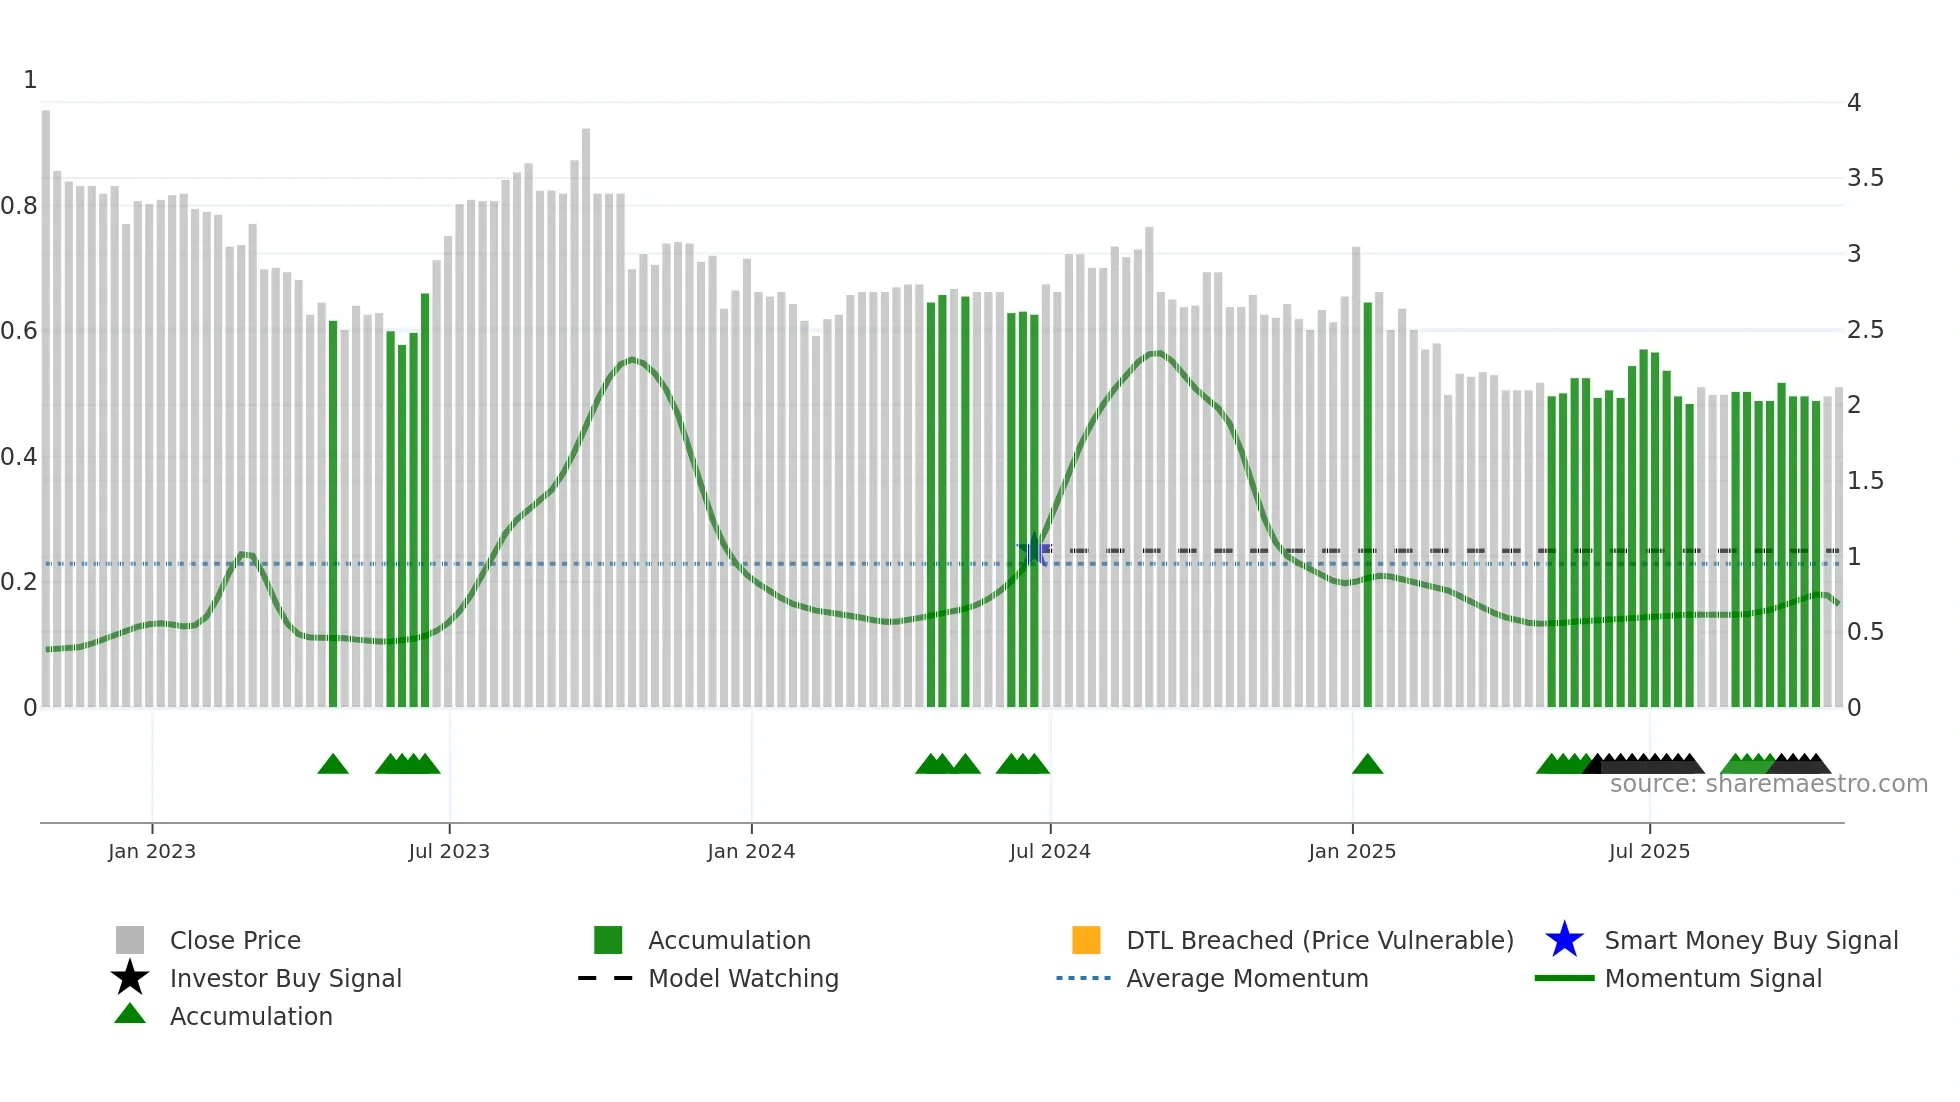
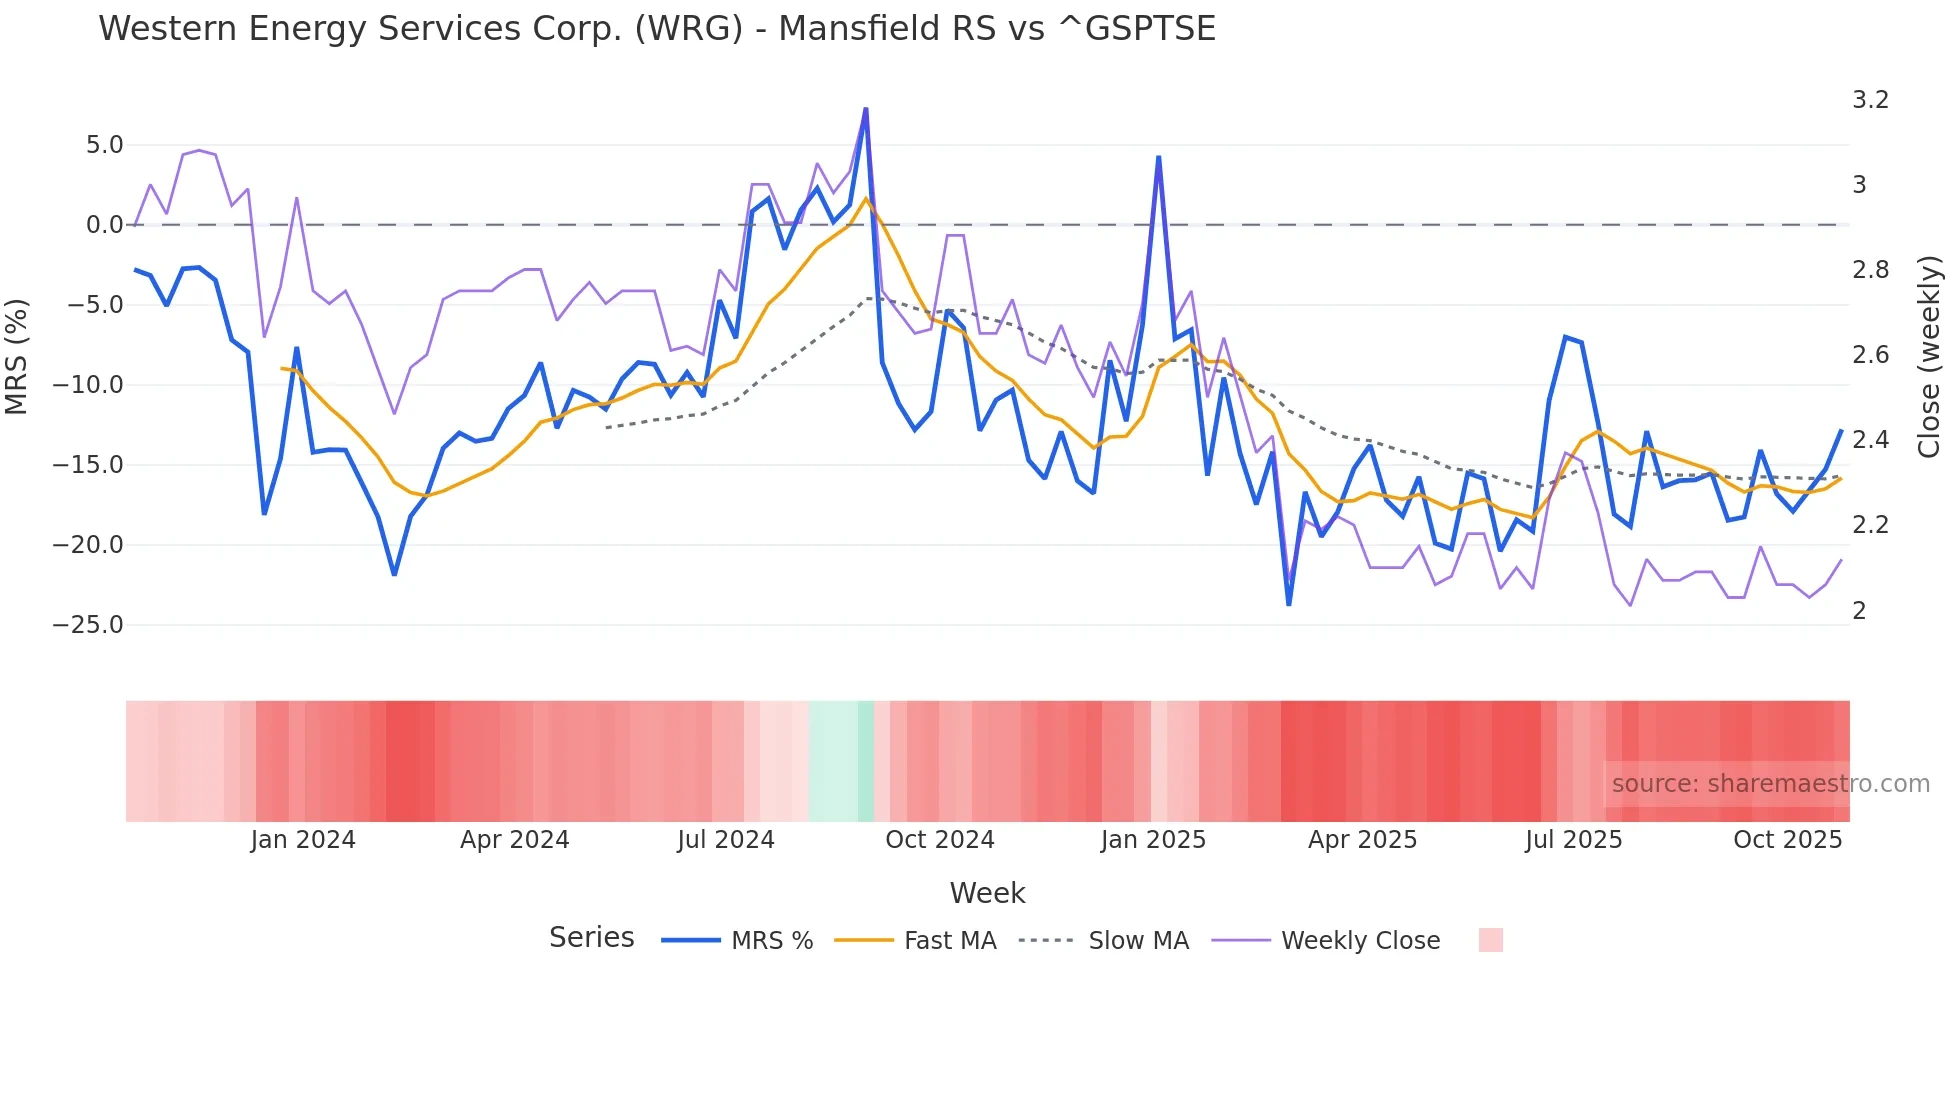
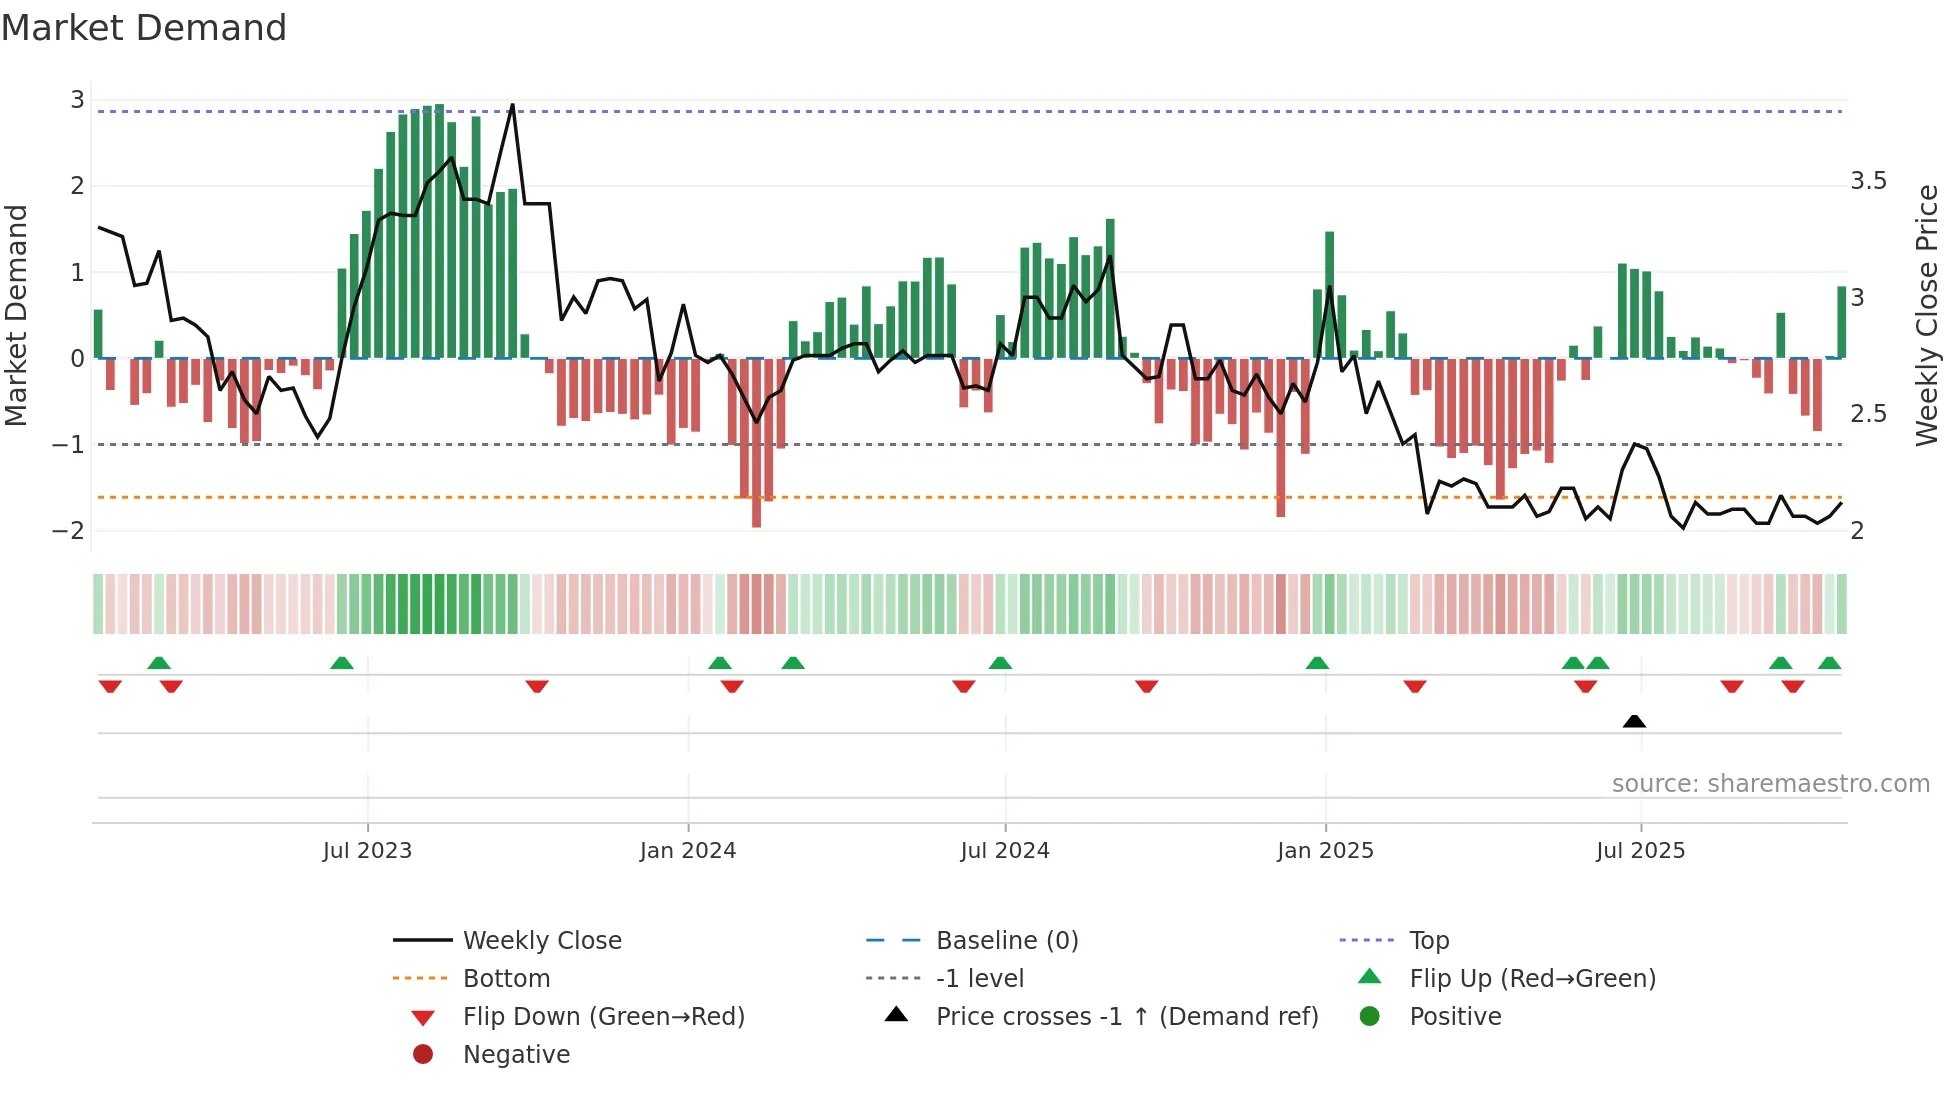
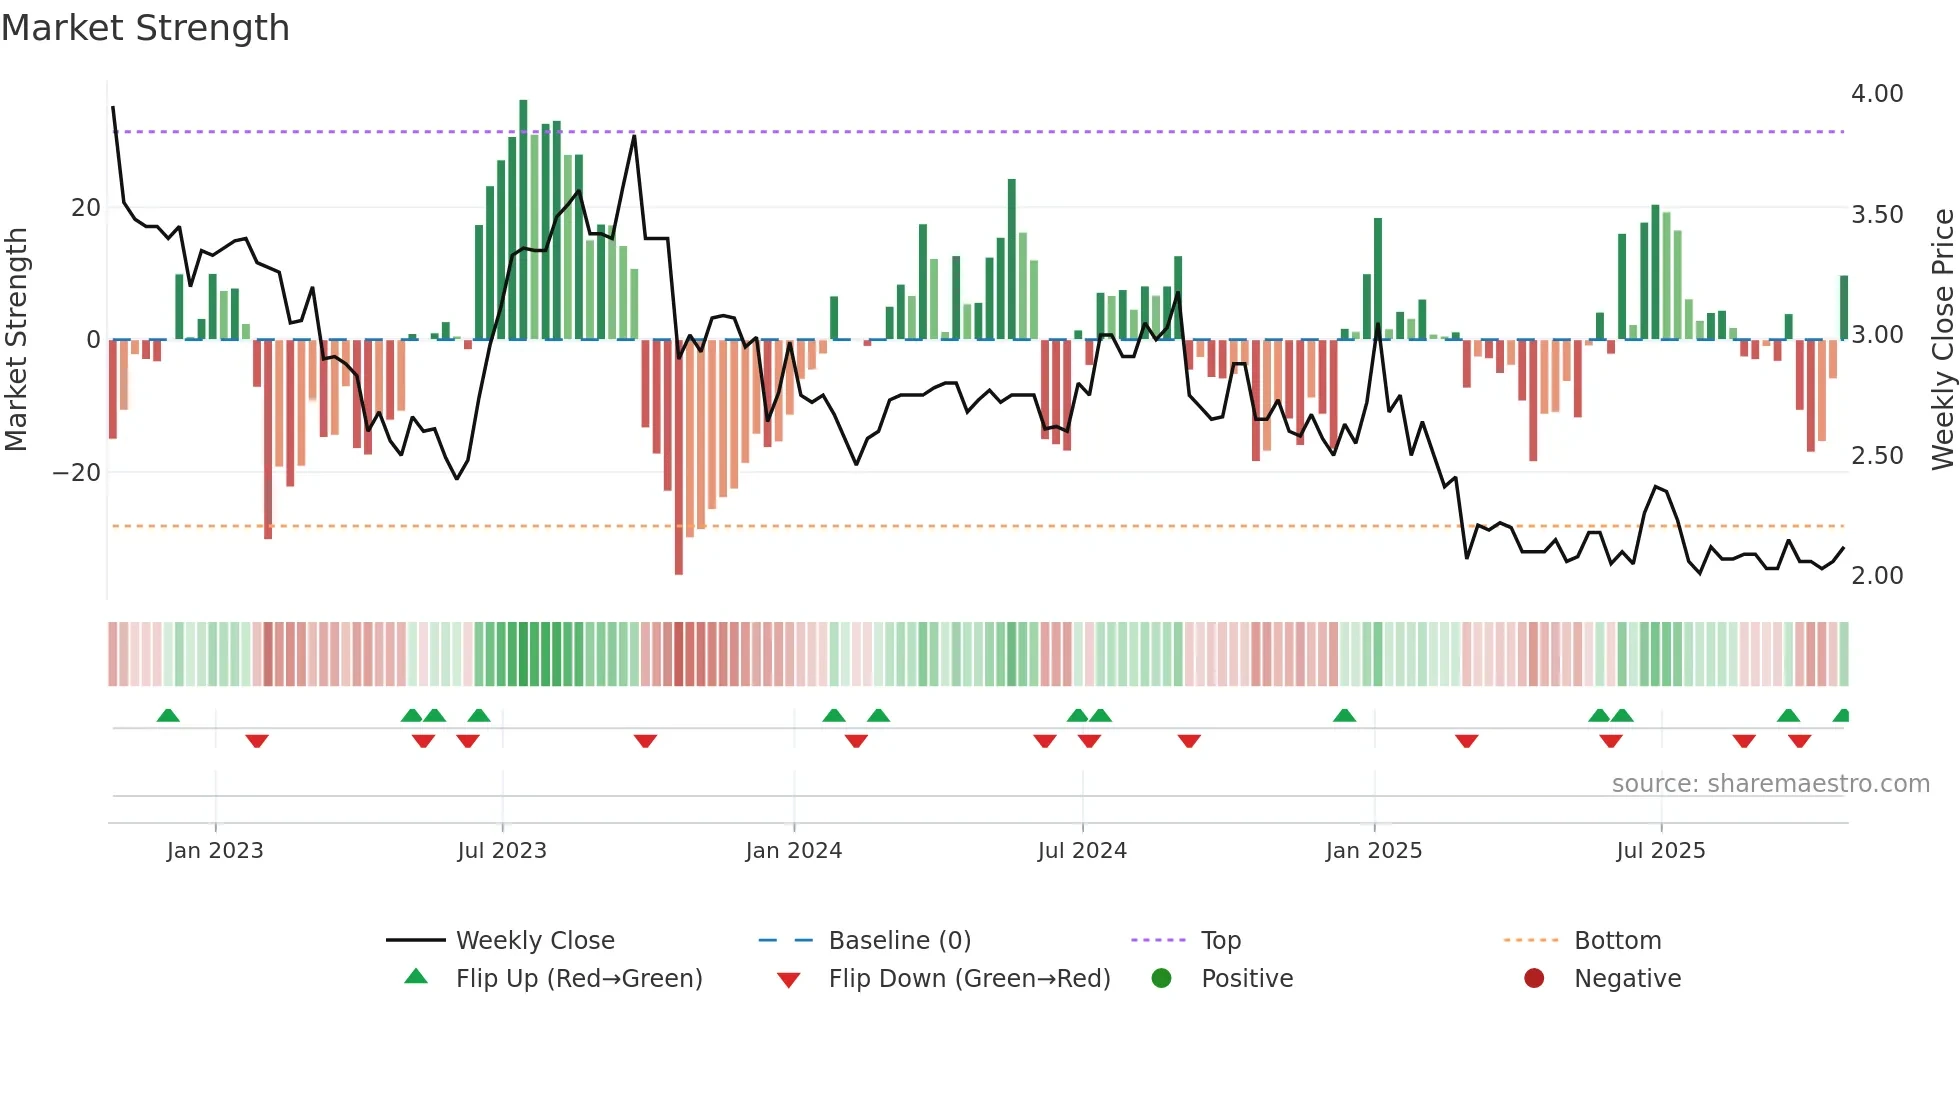
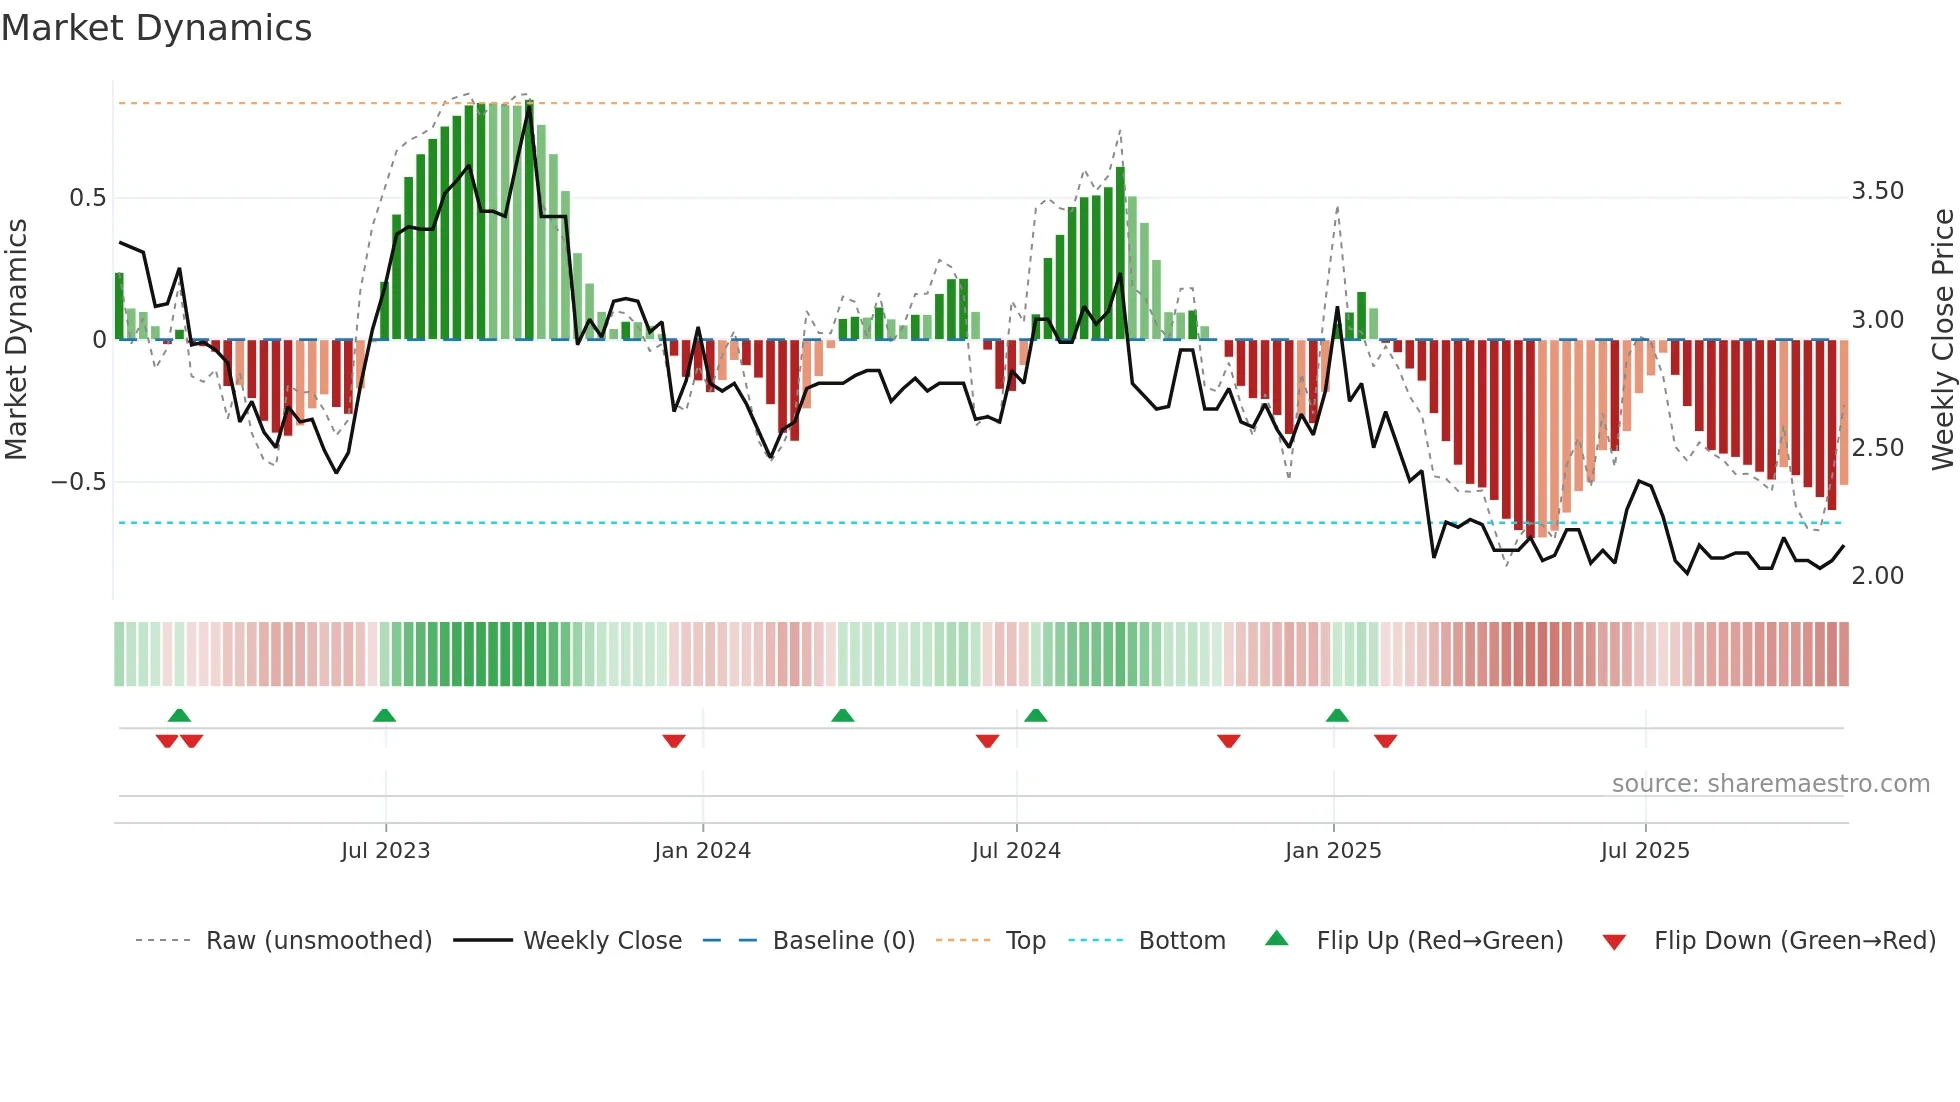
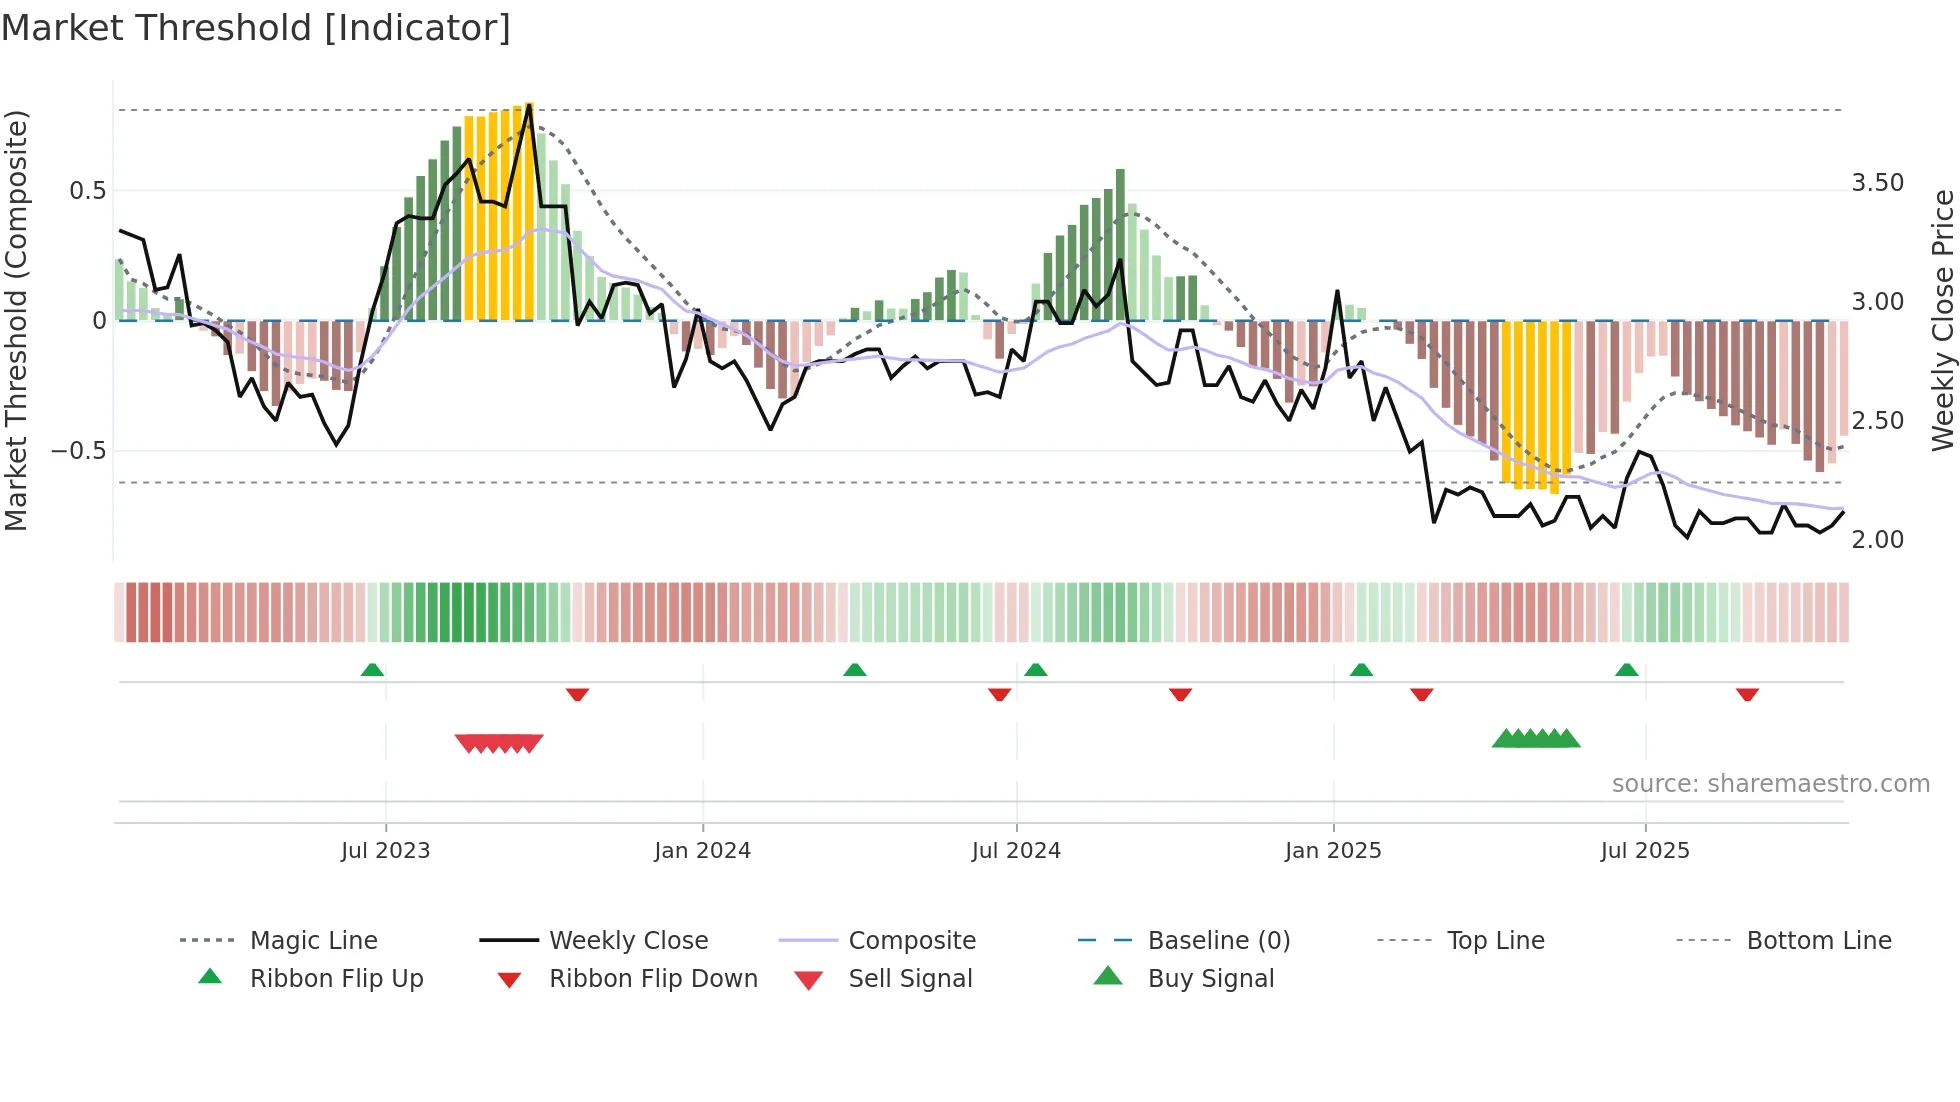
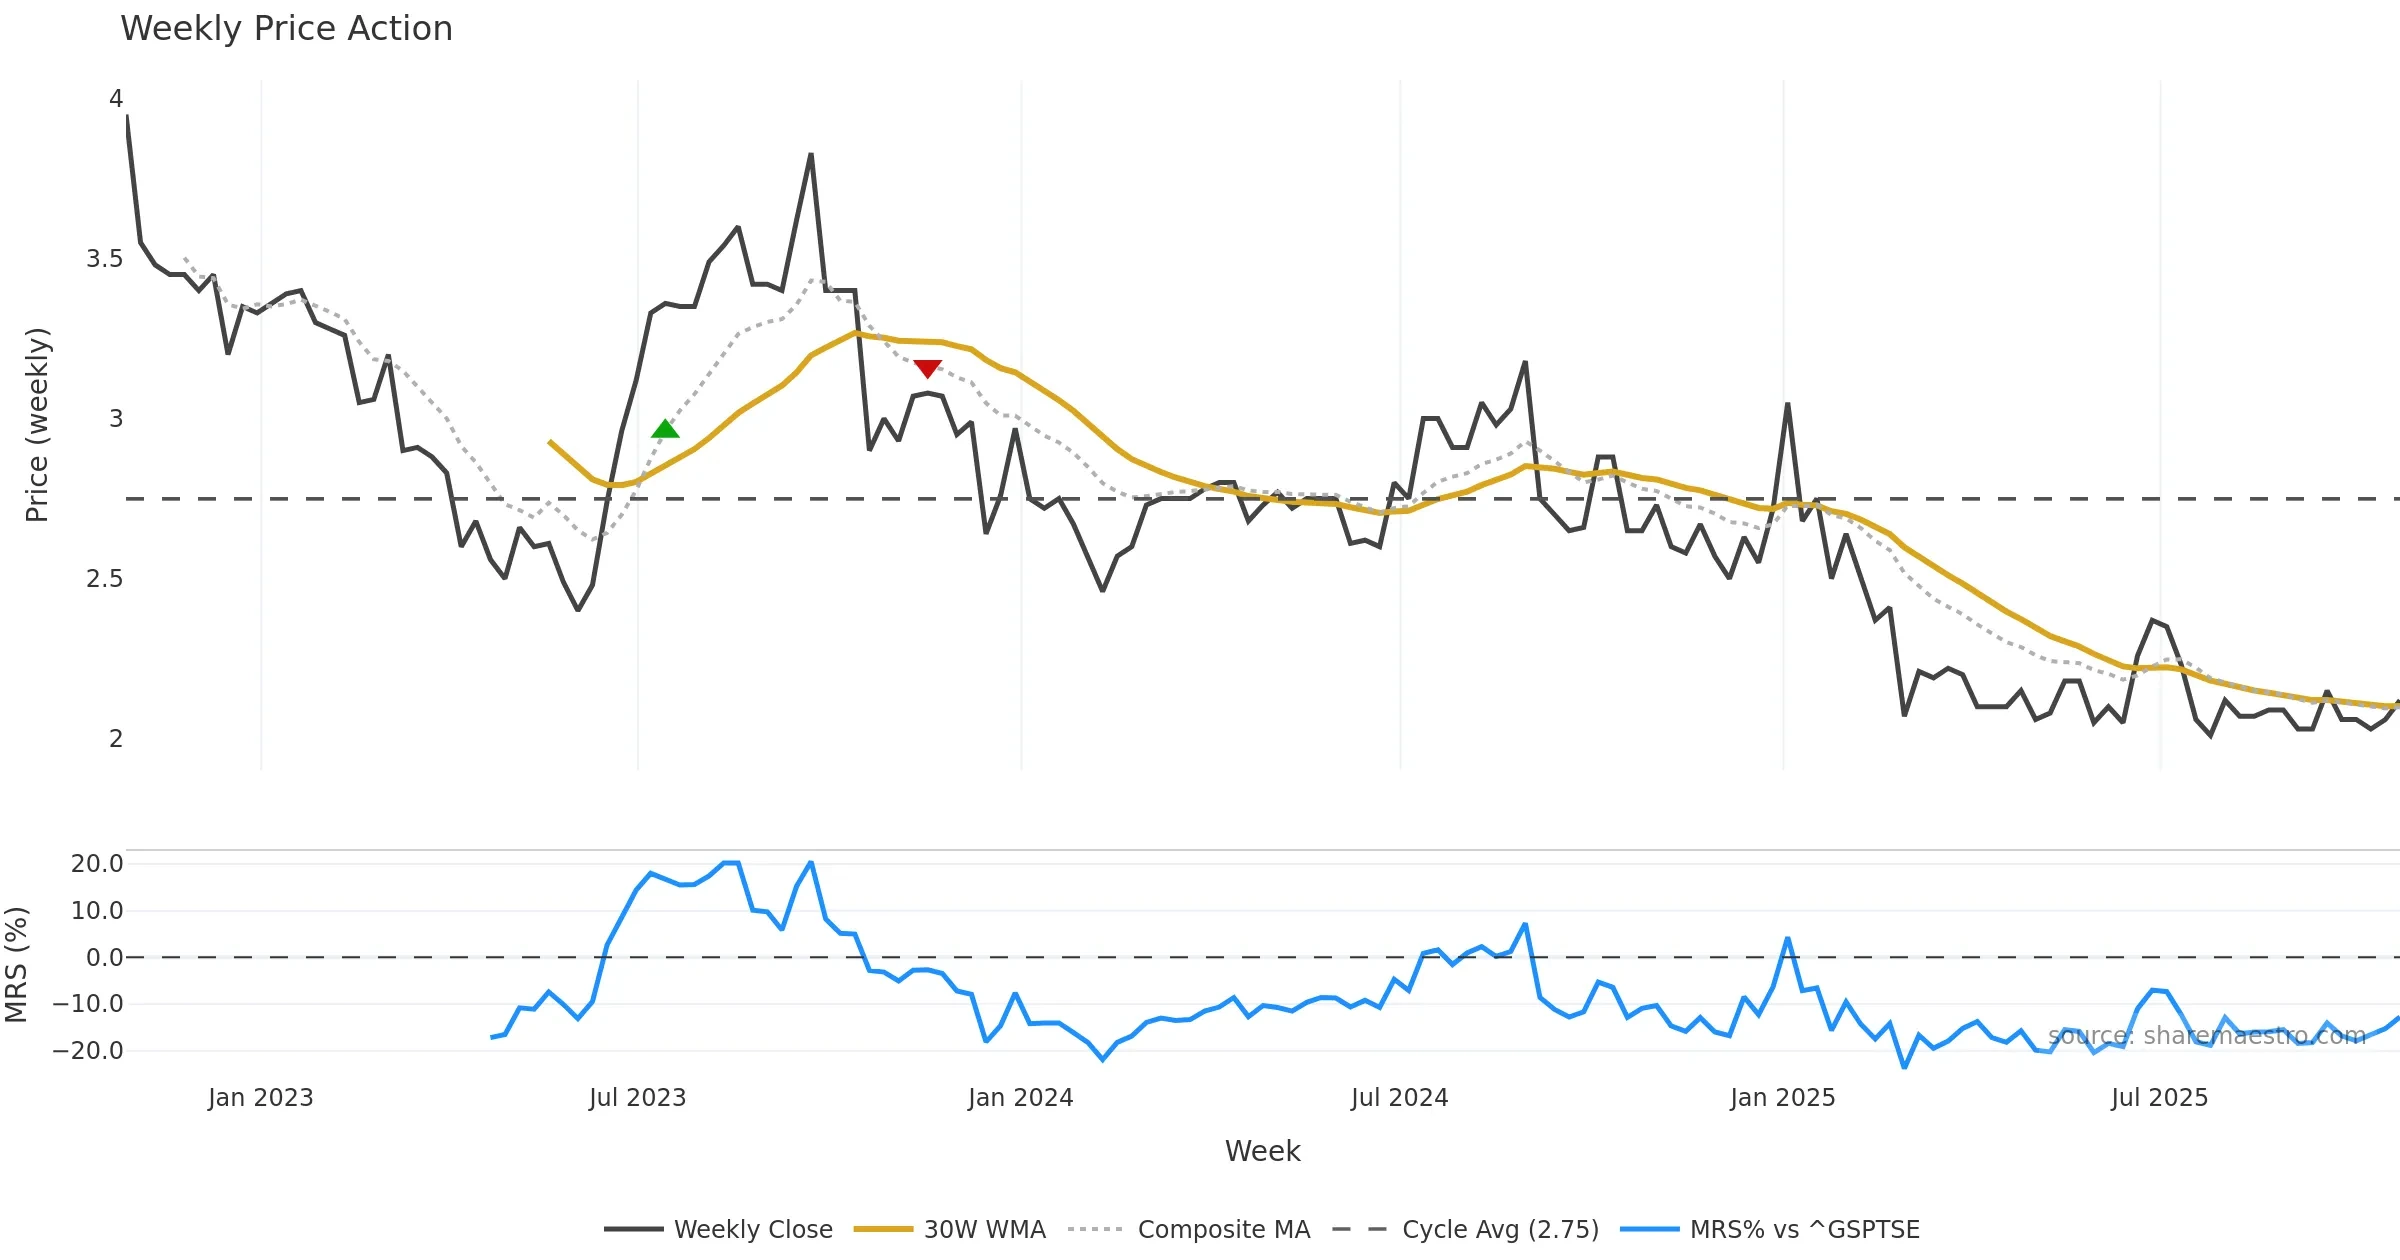
Early accumulation: trend rising from a depressed zone while pressure is sub-zero. Often precedes Smart-Money style entries. In essence this reflects institutional activity / accumulation-distribution patterns with a bullish tilt.
pol 0.75
conf 0.65
strong · high
What it means
Early accumulation: trend rising from a depressed zone while pressure is sub-zero. Often precedes Smart-Money style entries. In essence this reflects institutional activity / accumulation-distribution patterns with a bullish tilt.
Implications
Improves odds for follow-through if pullbacks hold higher lows. (pol 0.75, conf 0.65 → strong/high)
No additional observations.