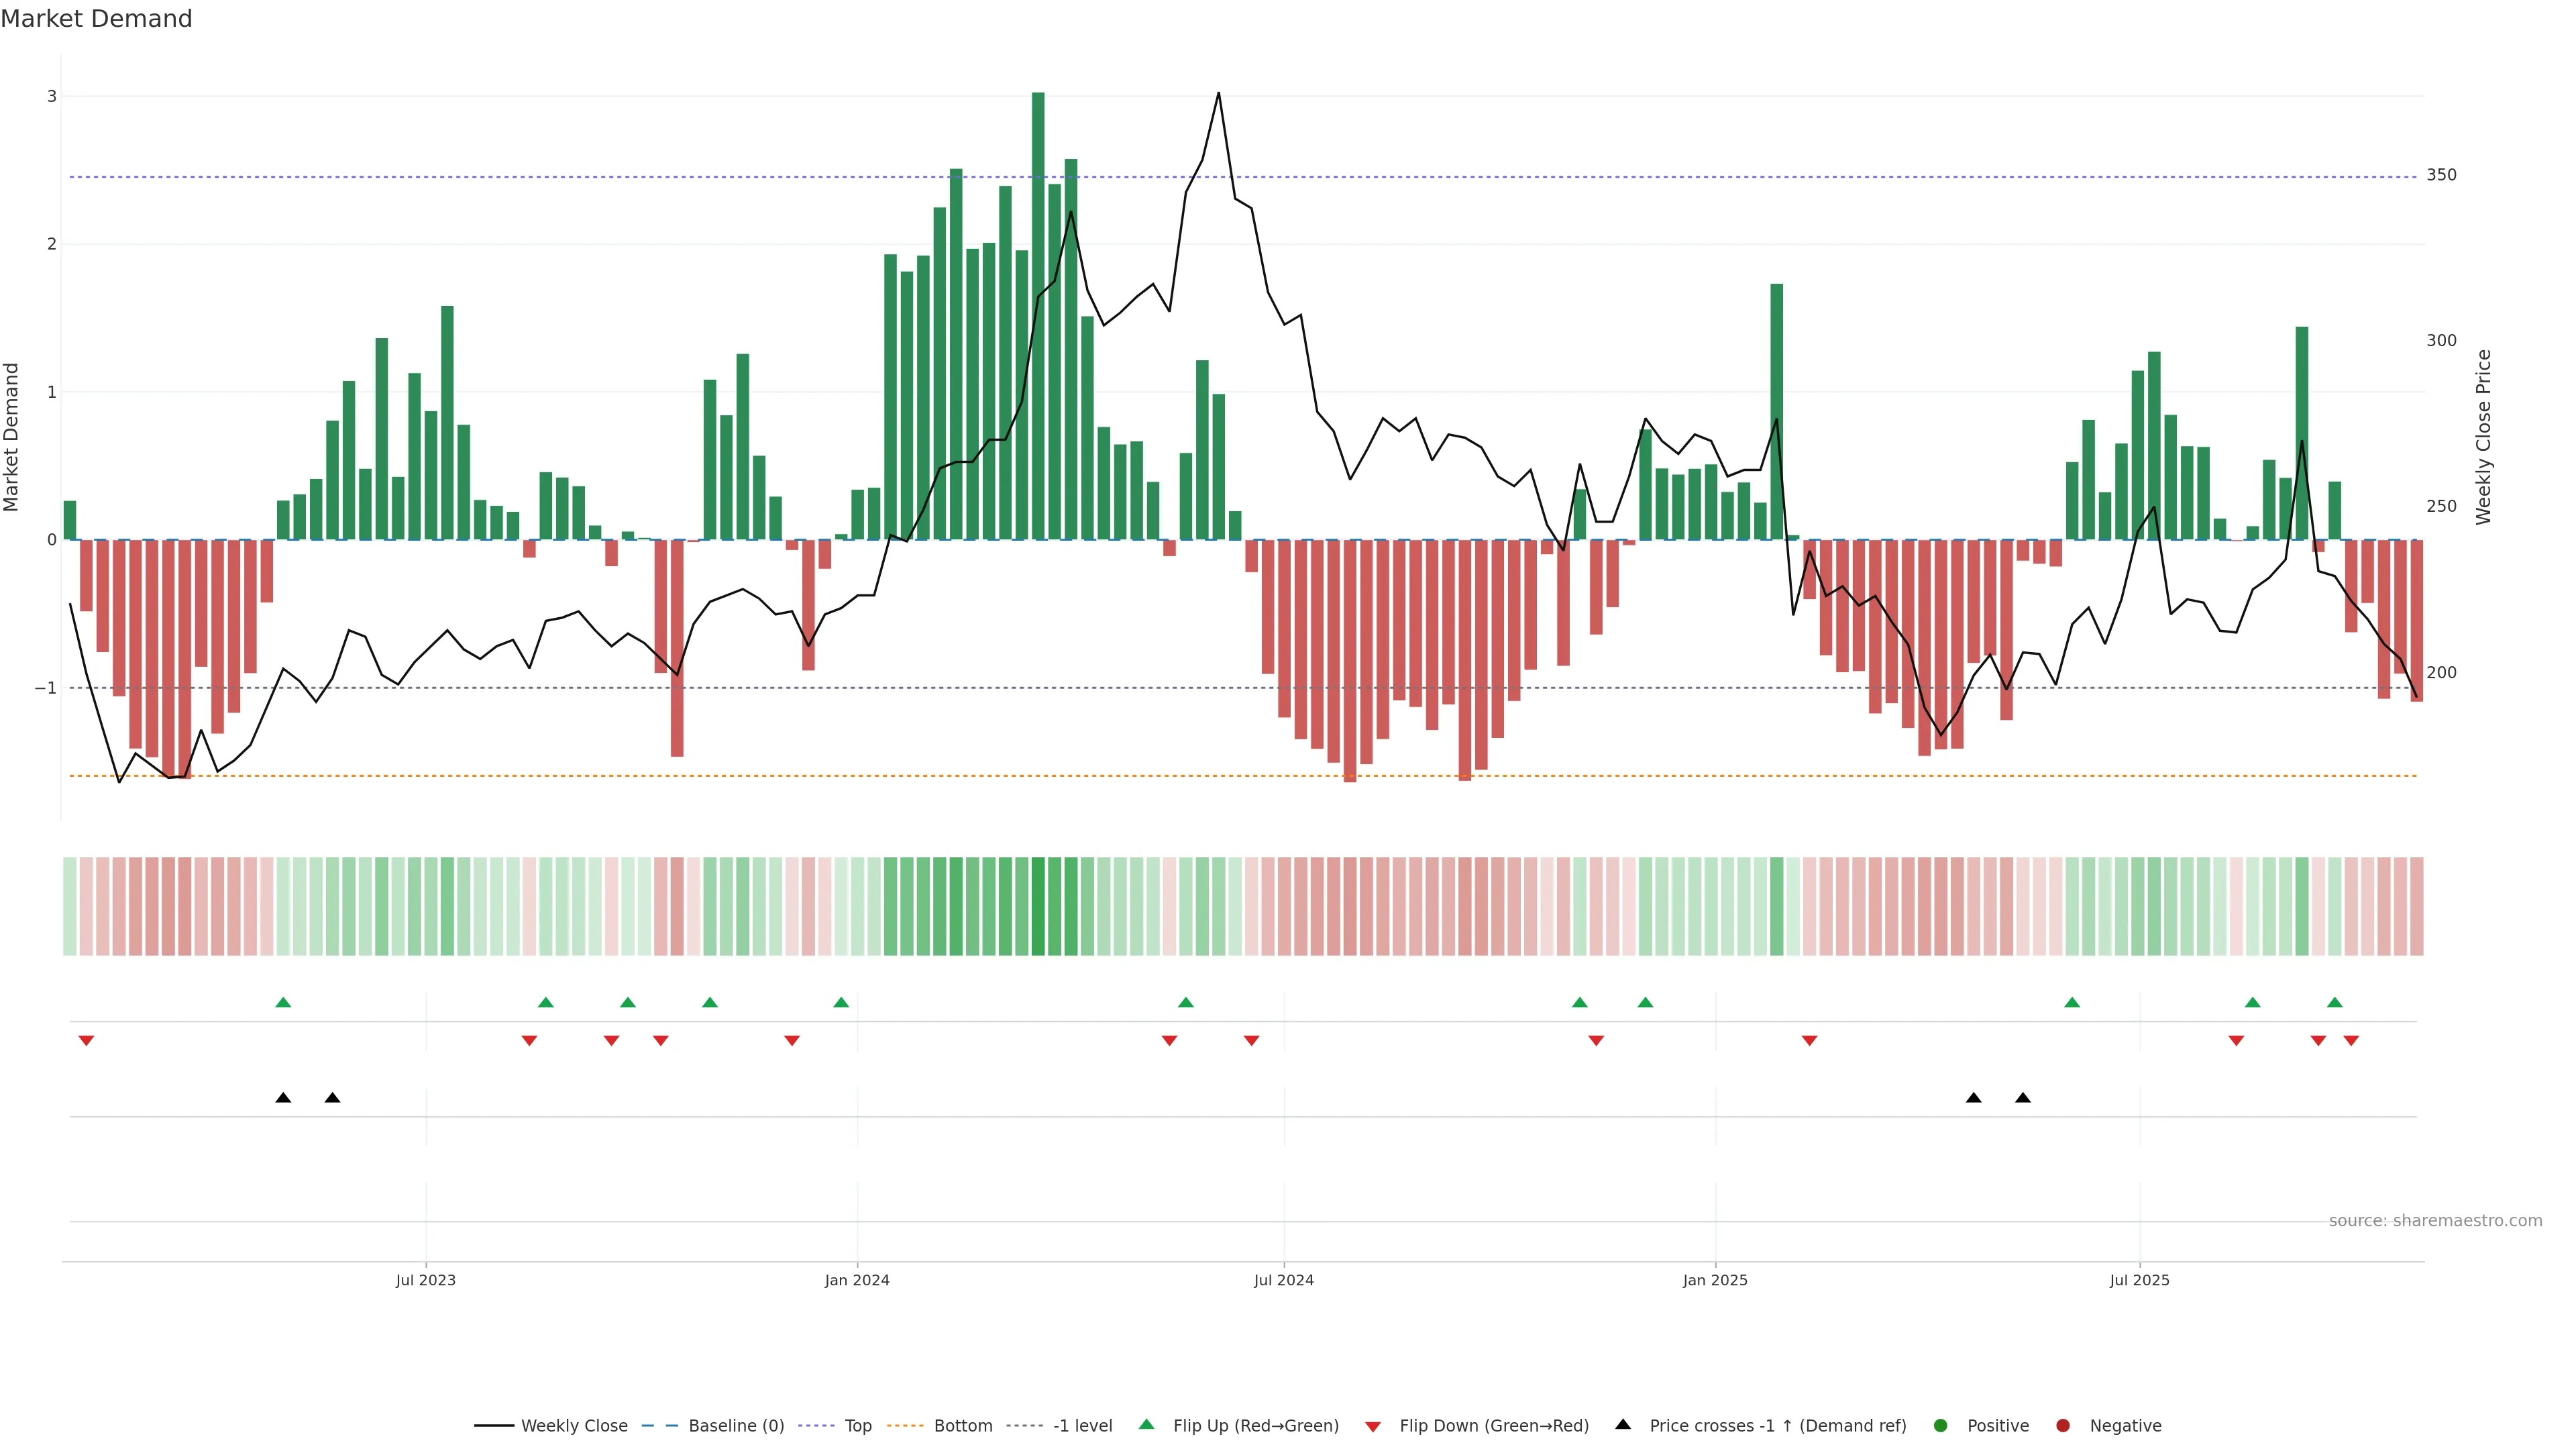
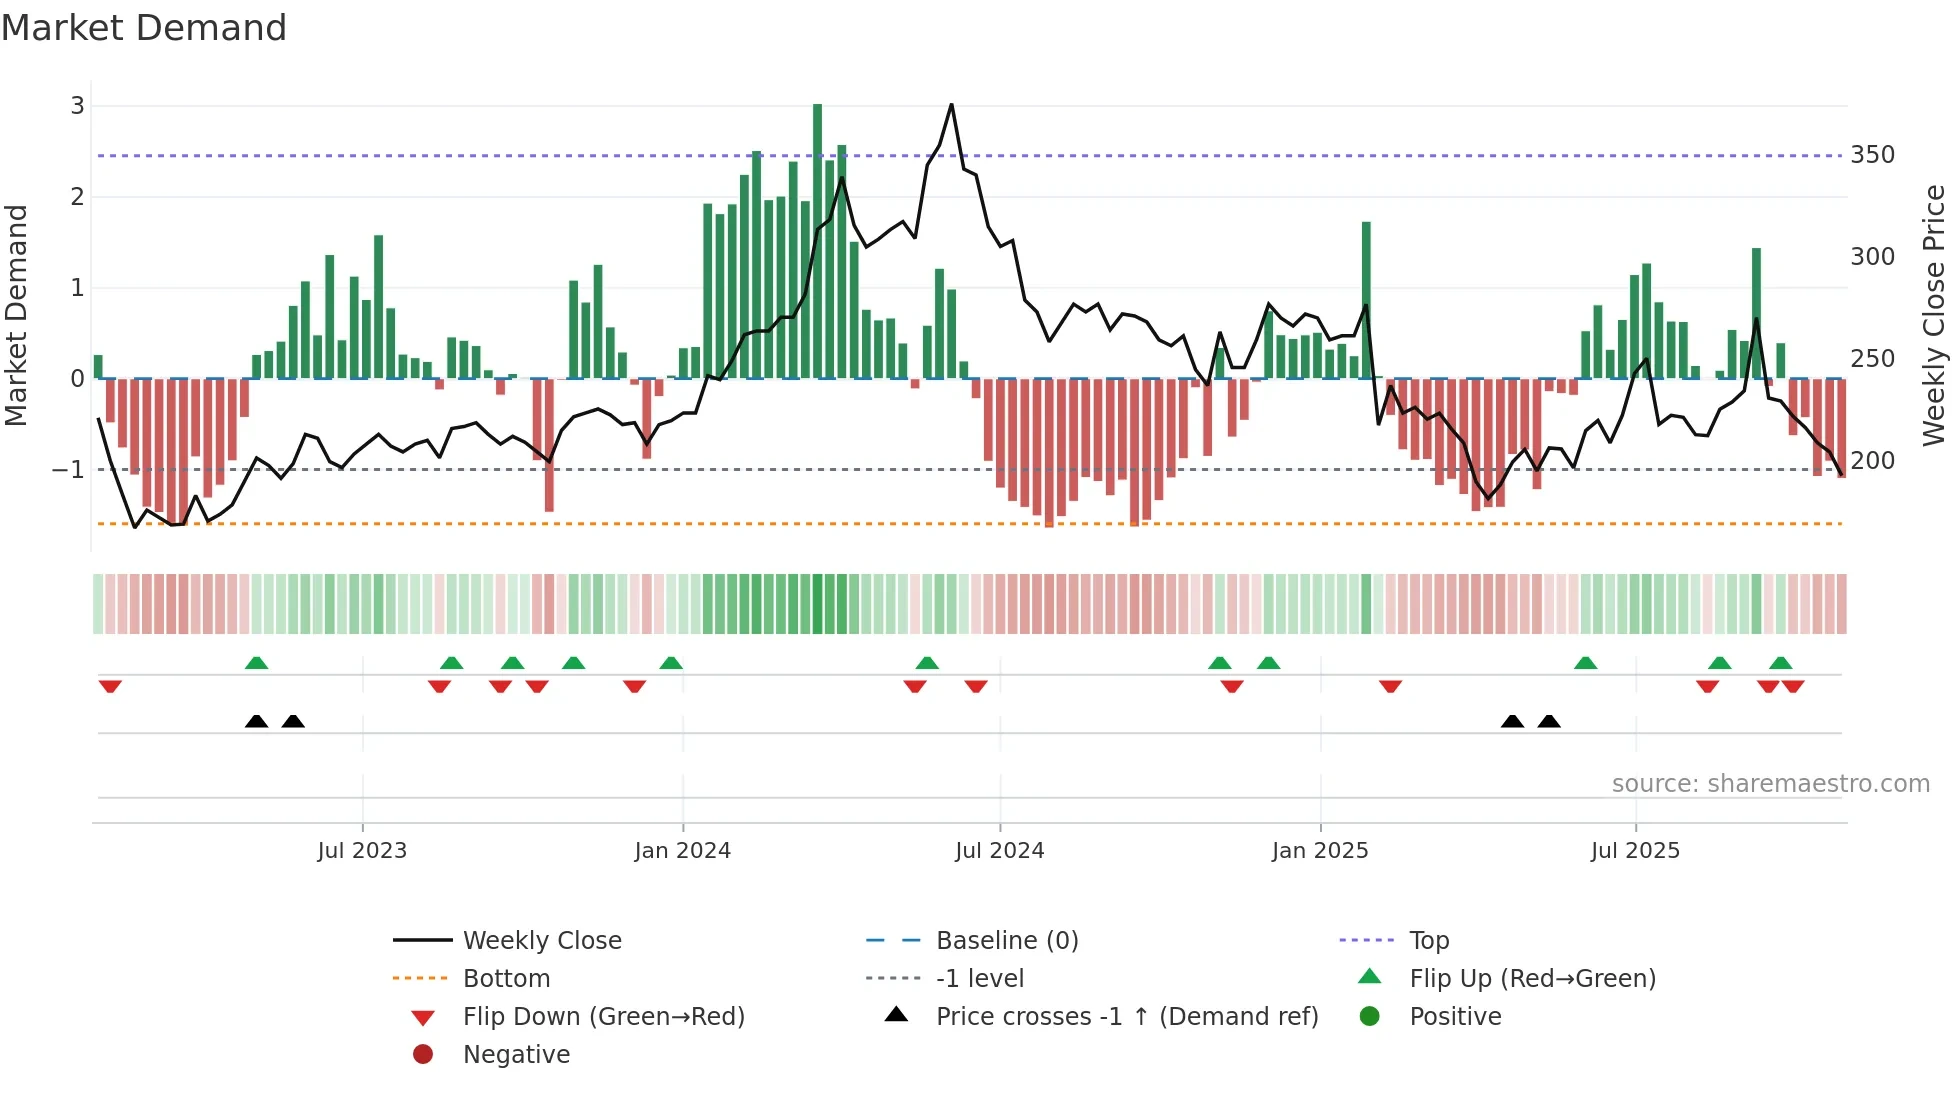
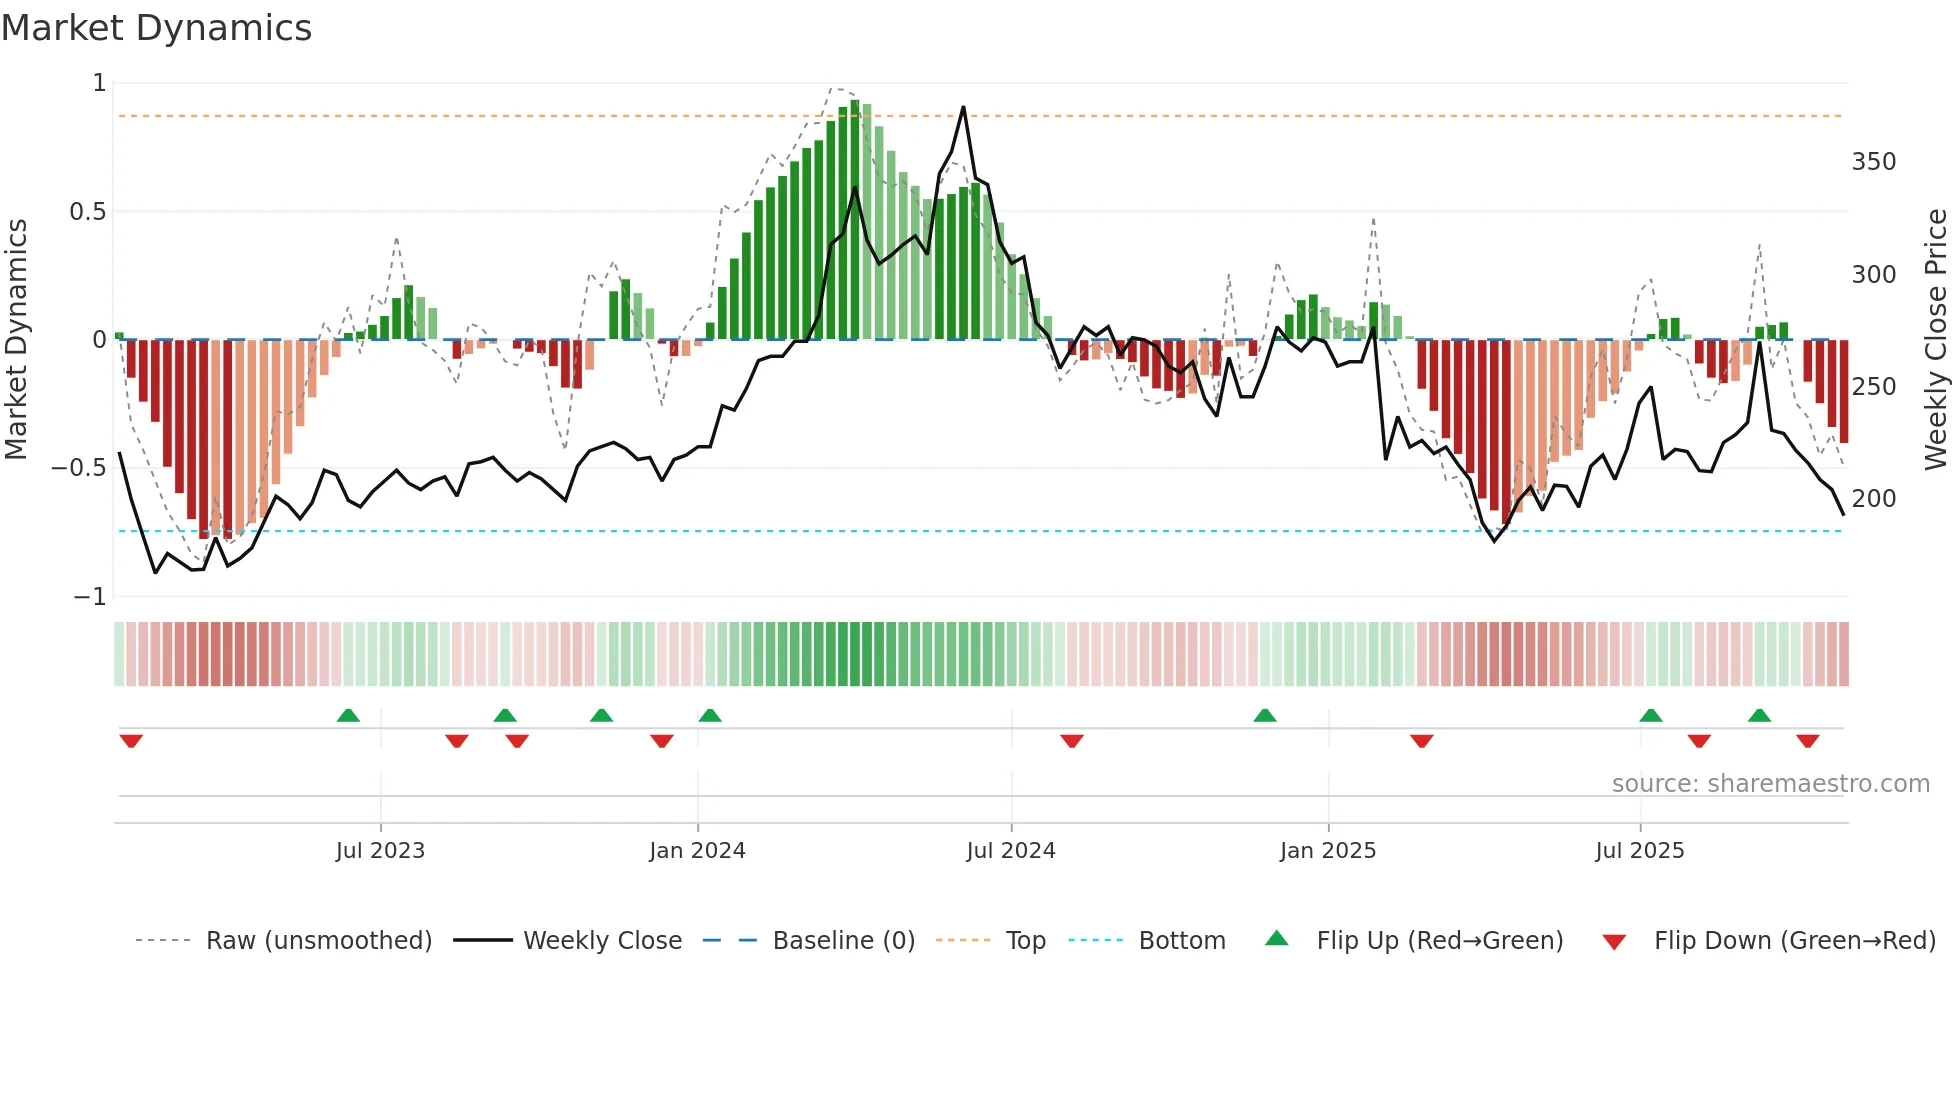
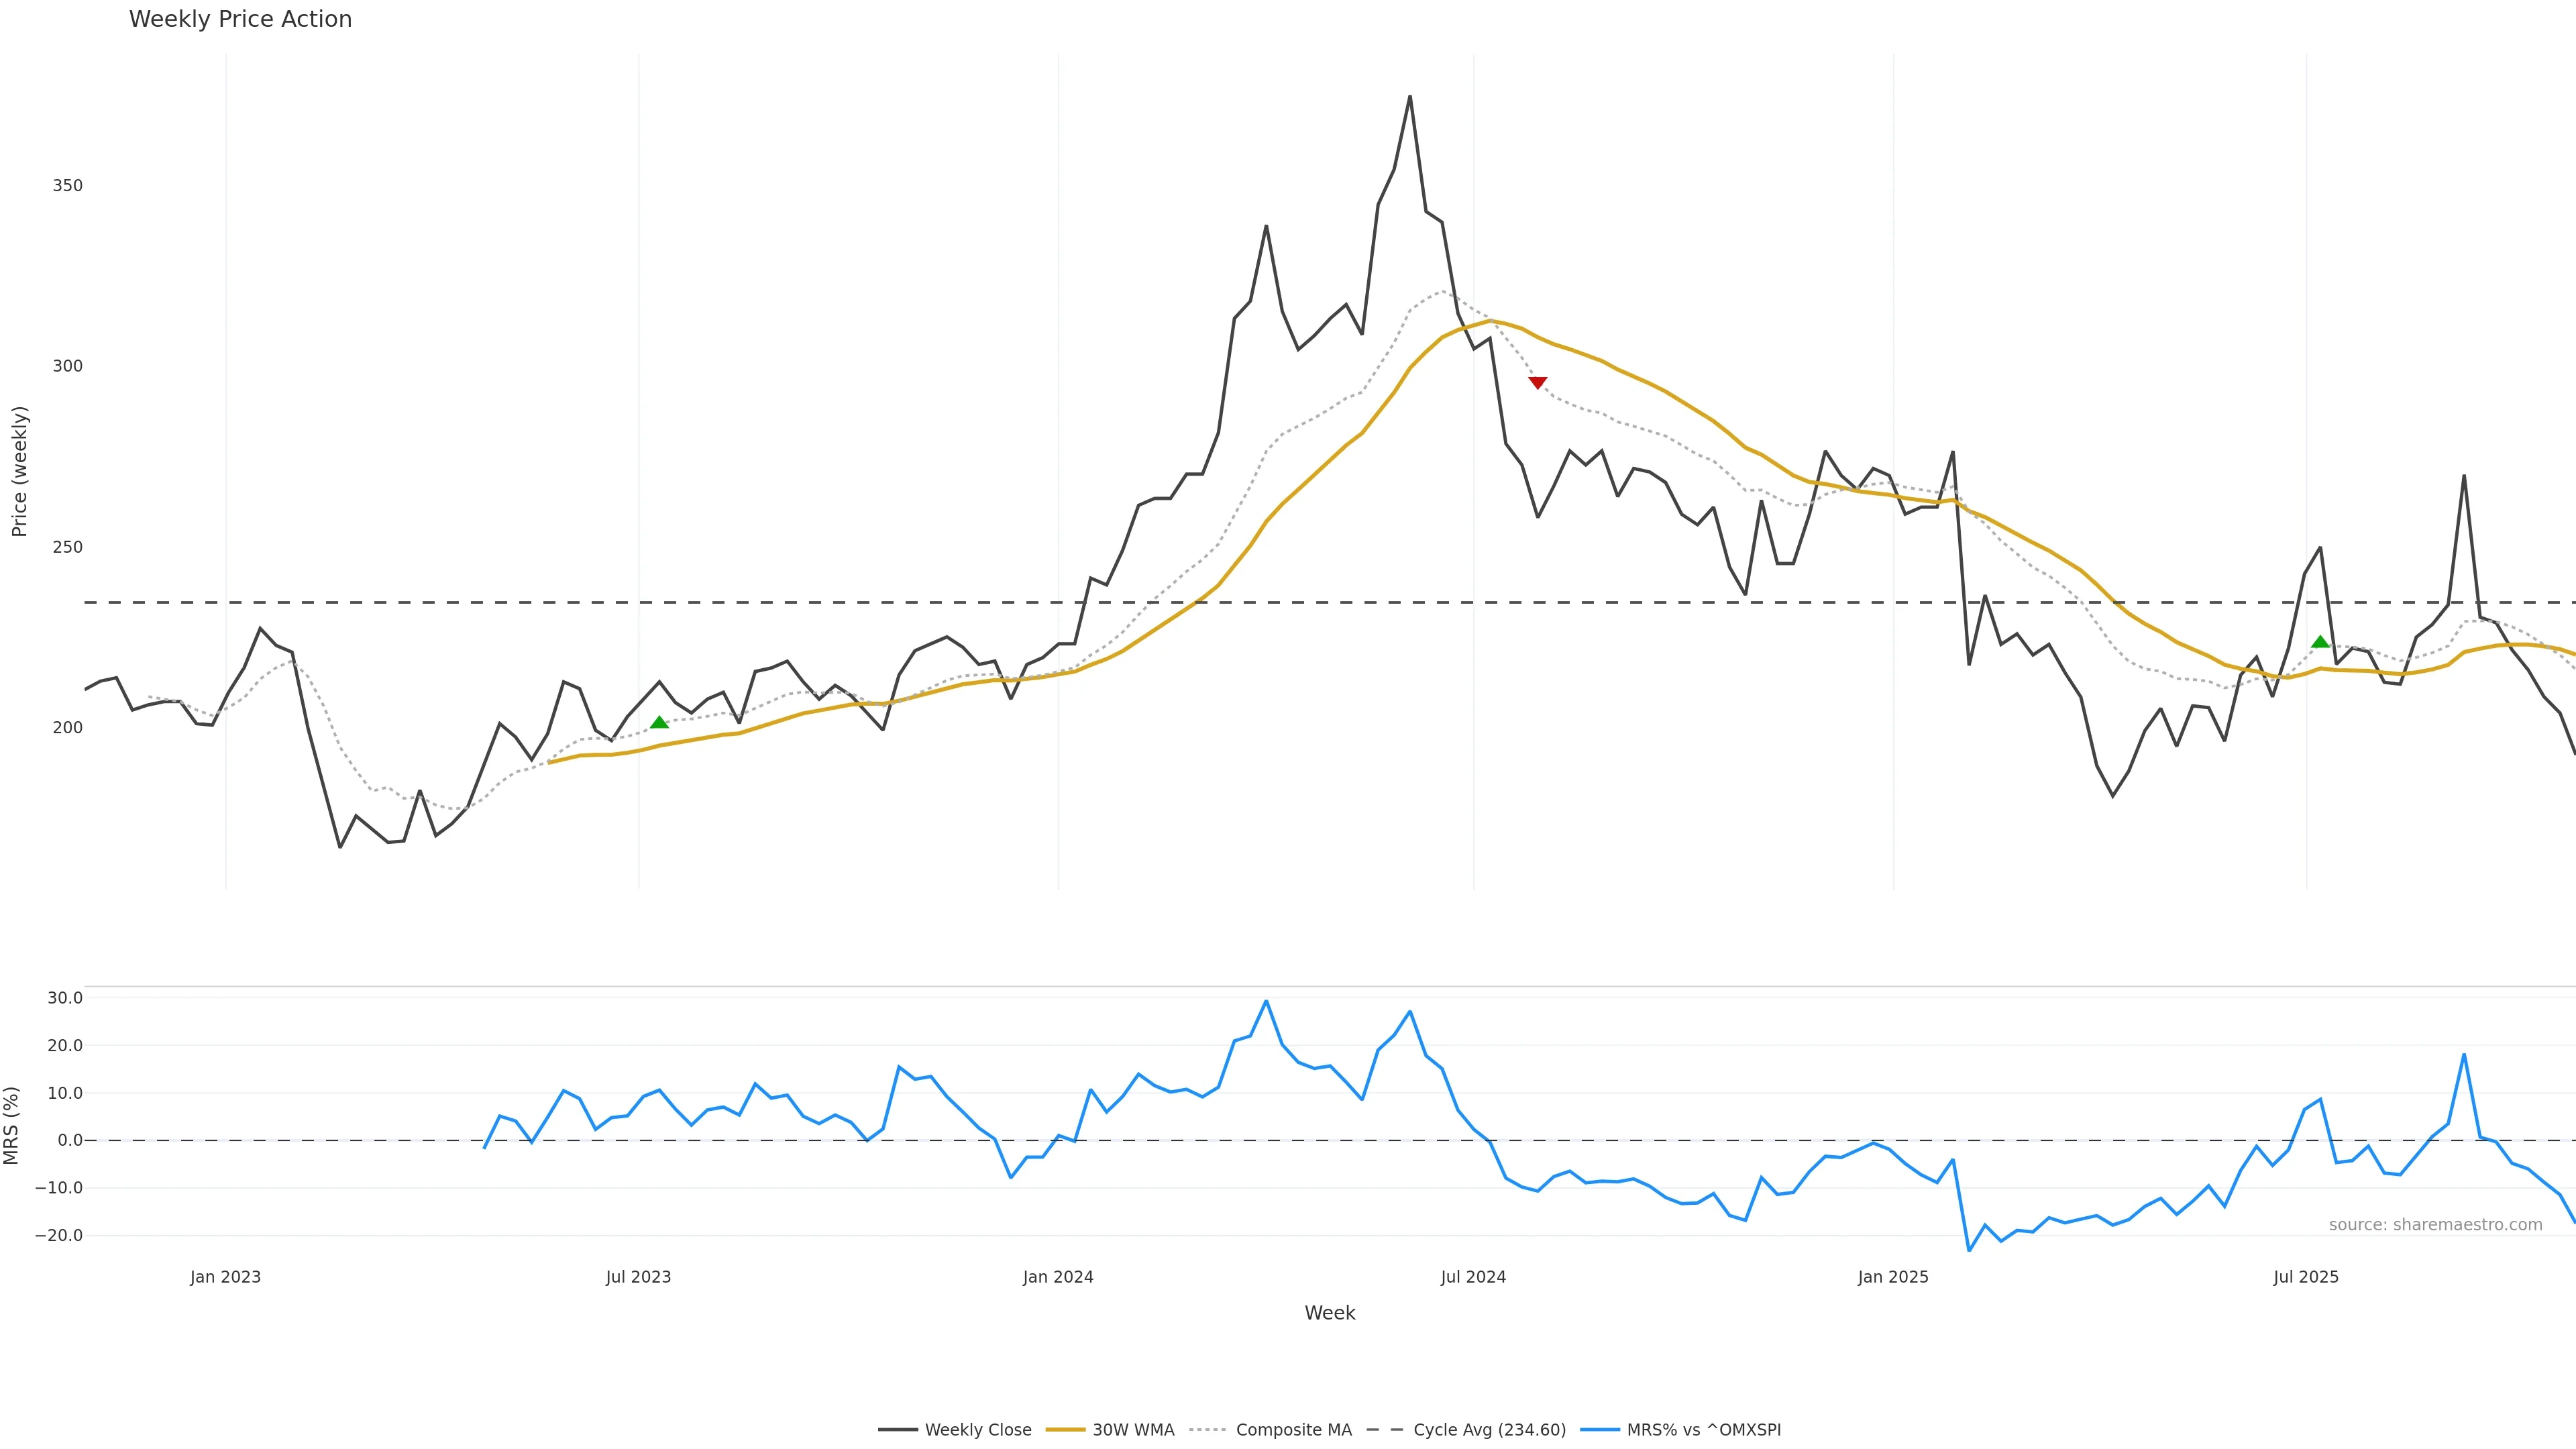
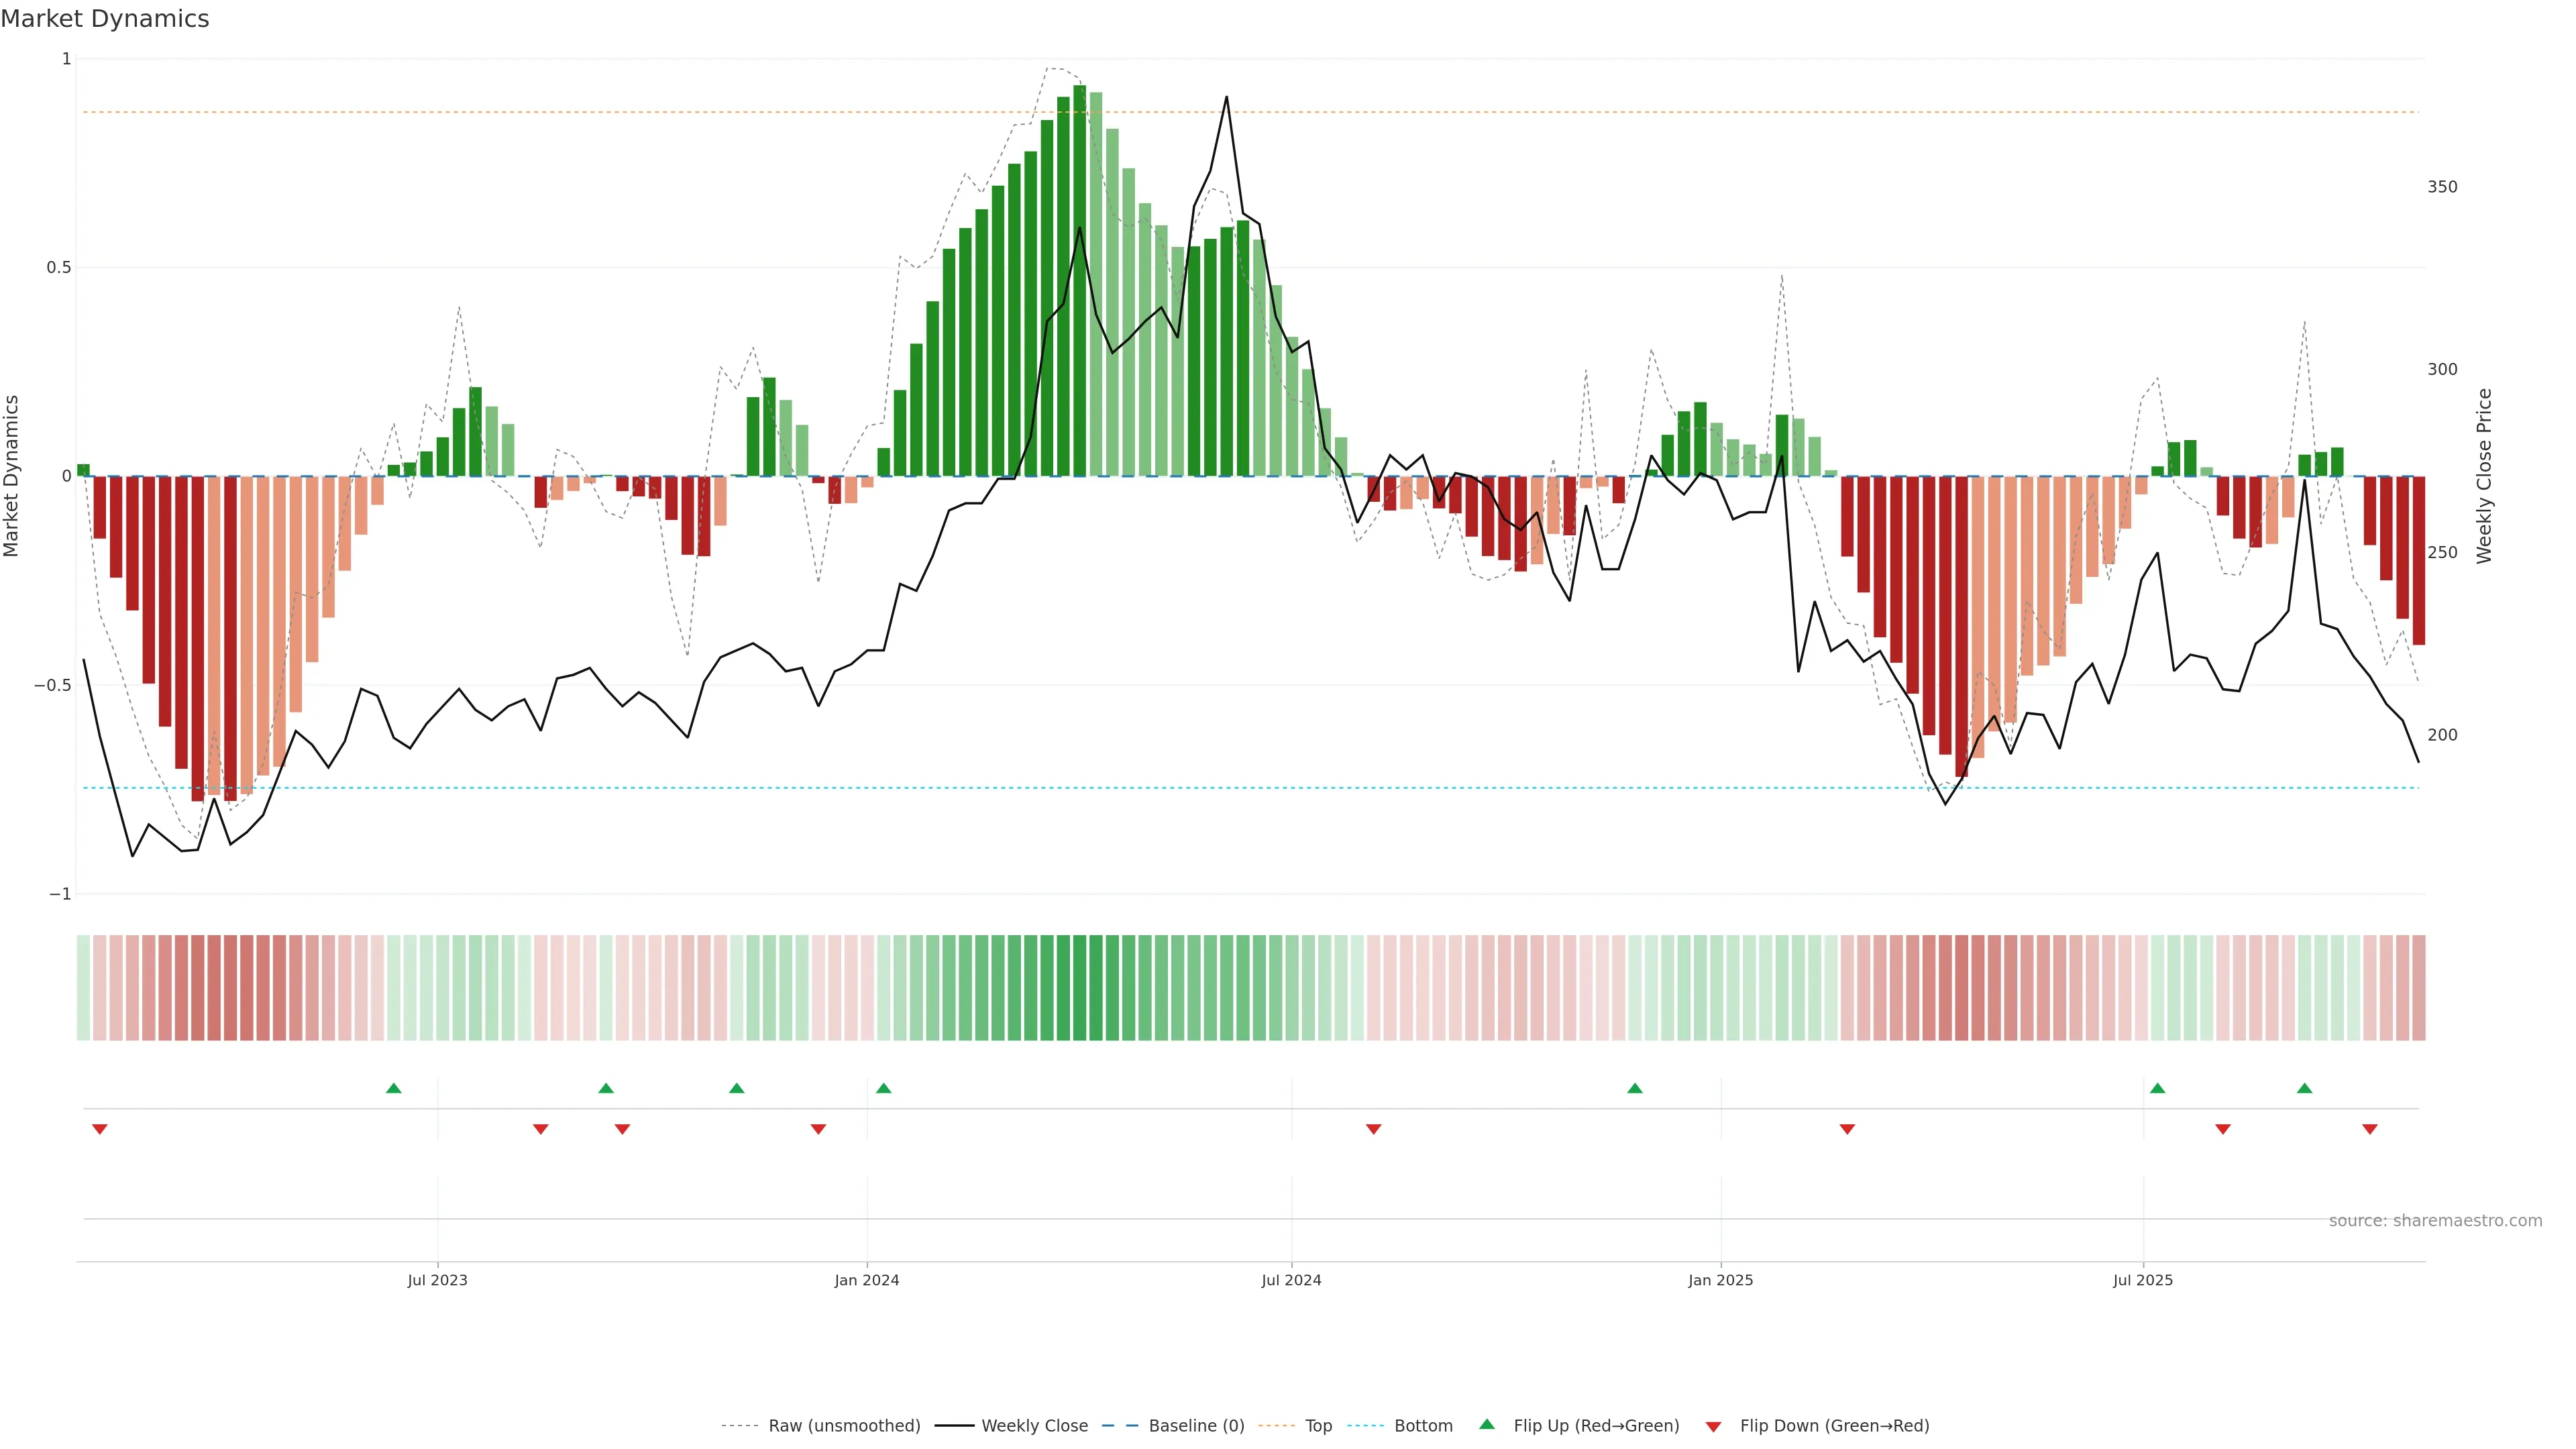
Menu
No results found.
Weekly Share Price & Valuation Overview
CTT Systems AB (publ)
CTT Systems AB (publ) provides humidity control systems for aircraft in Sweden, Denmark, France, the United States, and internationally. The company offers humidifiers for passenger cabins, flight decks, crew rest compartments, and VIP/business jets under the Humidifier Onboard name; dehumidifiers; active moisture control systems for humidity control; and anti-condensation systems that reduces airlines' climate and environmental impact. It serves commercial airlines and private jets. CTT Systems AB (publ) was incorporated in 1991 and is based in Nyköping, Sweden.
- Healthy operating margin (≥15%) indicates efficient core operations.
- High gross margin (≥35%) suggests strong pricing power or cost control.
- Double-digit profit margin (≥10%) supports robust bottom-line economics.
- ROE ≥15% reflects strong returns on shareholder equity.
- ROA ≥7% shows efficient use of assets.
- Quick ratio ≥1.0 indicates obligations can be met without inventory.
- Market Cap Total equity value of the company (share price × shares outstanding).
- SEK 2.78B
- Enterprise Value Operating value: market cap + total debt − cash.
- SEK 2.81B
- Total Revenue (TTM) Sales over the last twelve months. May be estimated from revenue per share when inconsistent.
- SEK 275.10M
- Gross Profit (TTM) Revenue minus cost of goods sold over the last twelve months. Hidden for financial institutions or if redundant.
- SEK 206.90M
- EBITDA (TTM) Earnings before interest, taxes, depreciation and amortization (TTM). Hidden for financials or if implausible.
- SEK 71.90M
- Revenue per Share (TTM) Total revenue divided by shares outstanding (may be estimated).
- SEK 21.92
- EPS (TTM) Earnings per share over the last twelve months (may be estimated from net income ÷ shares).
- 4.39
- Dividend Yield Annual dividend ÷ share price. Reconciled using dividend per share when available.
- 2.42%
- Shares Outstanding
- 12.53M
- Float Shares
- 9.64M
- Implied Shares Outstanding
- 12.53M
- Operating Margin (TTM) Strong Operating income ÷ revenue over the last twelve months (reconciled when possible).
-
18.60%
- EBITDA Margin (TTM) Reconciled EBITDA ÷ revenue over the last twelve months (suppressed if EBITDA implausible/financials).
-
26.14%
- Gross Margin (TTM) Reconciled Strong Gross profit ÷ revenue over the last twelve months (reconciled when possible).
-
75.21%
- Profit Margin (TTM) Solid Net income ÷ revenue over the last twelve months (reconciled when possible).
-
19.99%
- ROA Strong Return on assets: net income ÷ total assets.
-
11.97%
- ROE Excellent Return on equity: net income ÷ shareholder equity.
-
22.17%
- Revenue Growth Year-over-year revenue growth.
-
-3.60%
- Earnings Growth (YoY) Year-over-year earnings growth.
-
-39.40%
- Earnings Growth (QoQ) Quarter-over-quarter earnings growth.
-
-39.40%
- Quick Ratio Adequate Liquid current assets ÷ current liabilities (ex-inventory).
- 1.51
- Debt to Equity Total debt ÷ shareholder equity; leverage.
- 0.15
- Total Cash Cash and equivalents.
- SEK 2.40M
- Total Debt Short + long-term interest-bearing debt.
- SEK 37.40M
- Net Debt Total debt − cash (negative = net cash).
- SEK 35.00M
- Debt / EBITDA Leverage relative to operating earnings; lower is safer.
- 0.52
- Operating Cash Flow (TTM) Cash generated by core operations (pre-capex).
- SEK 31.90M
- Free Cash Flow (TTM) Cash after capex; funds buybacks, dividends, and debt paydown.
- SEK 12.50M
- OCF Margin (TTM) Operating cash flow ÷ revenue (TTM).
-
11.60%
- FCF Margin (TTM) Free cash flow ÷ revenue (TTM).
-
4.54%
- Cash Conversion (OpCF/EBITDA)
- 0.44
- Margins shown on a TTM basis. “Reconciled” = numerator ÷ TTM revenue for internal consistency.
- Cash Flow section is displayed only when figures are self-consistent (and hidden for financials).
Disclaimer: Information is compiled from publicly available sources and is subject to errors and omissions. It is provided as a guide only and does not constitute investment advice. Please do your own research.