
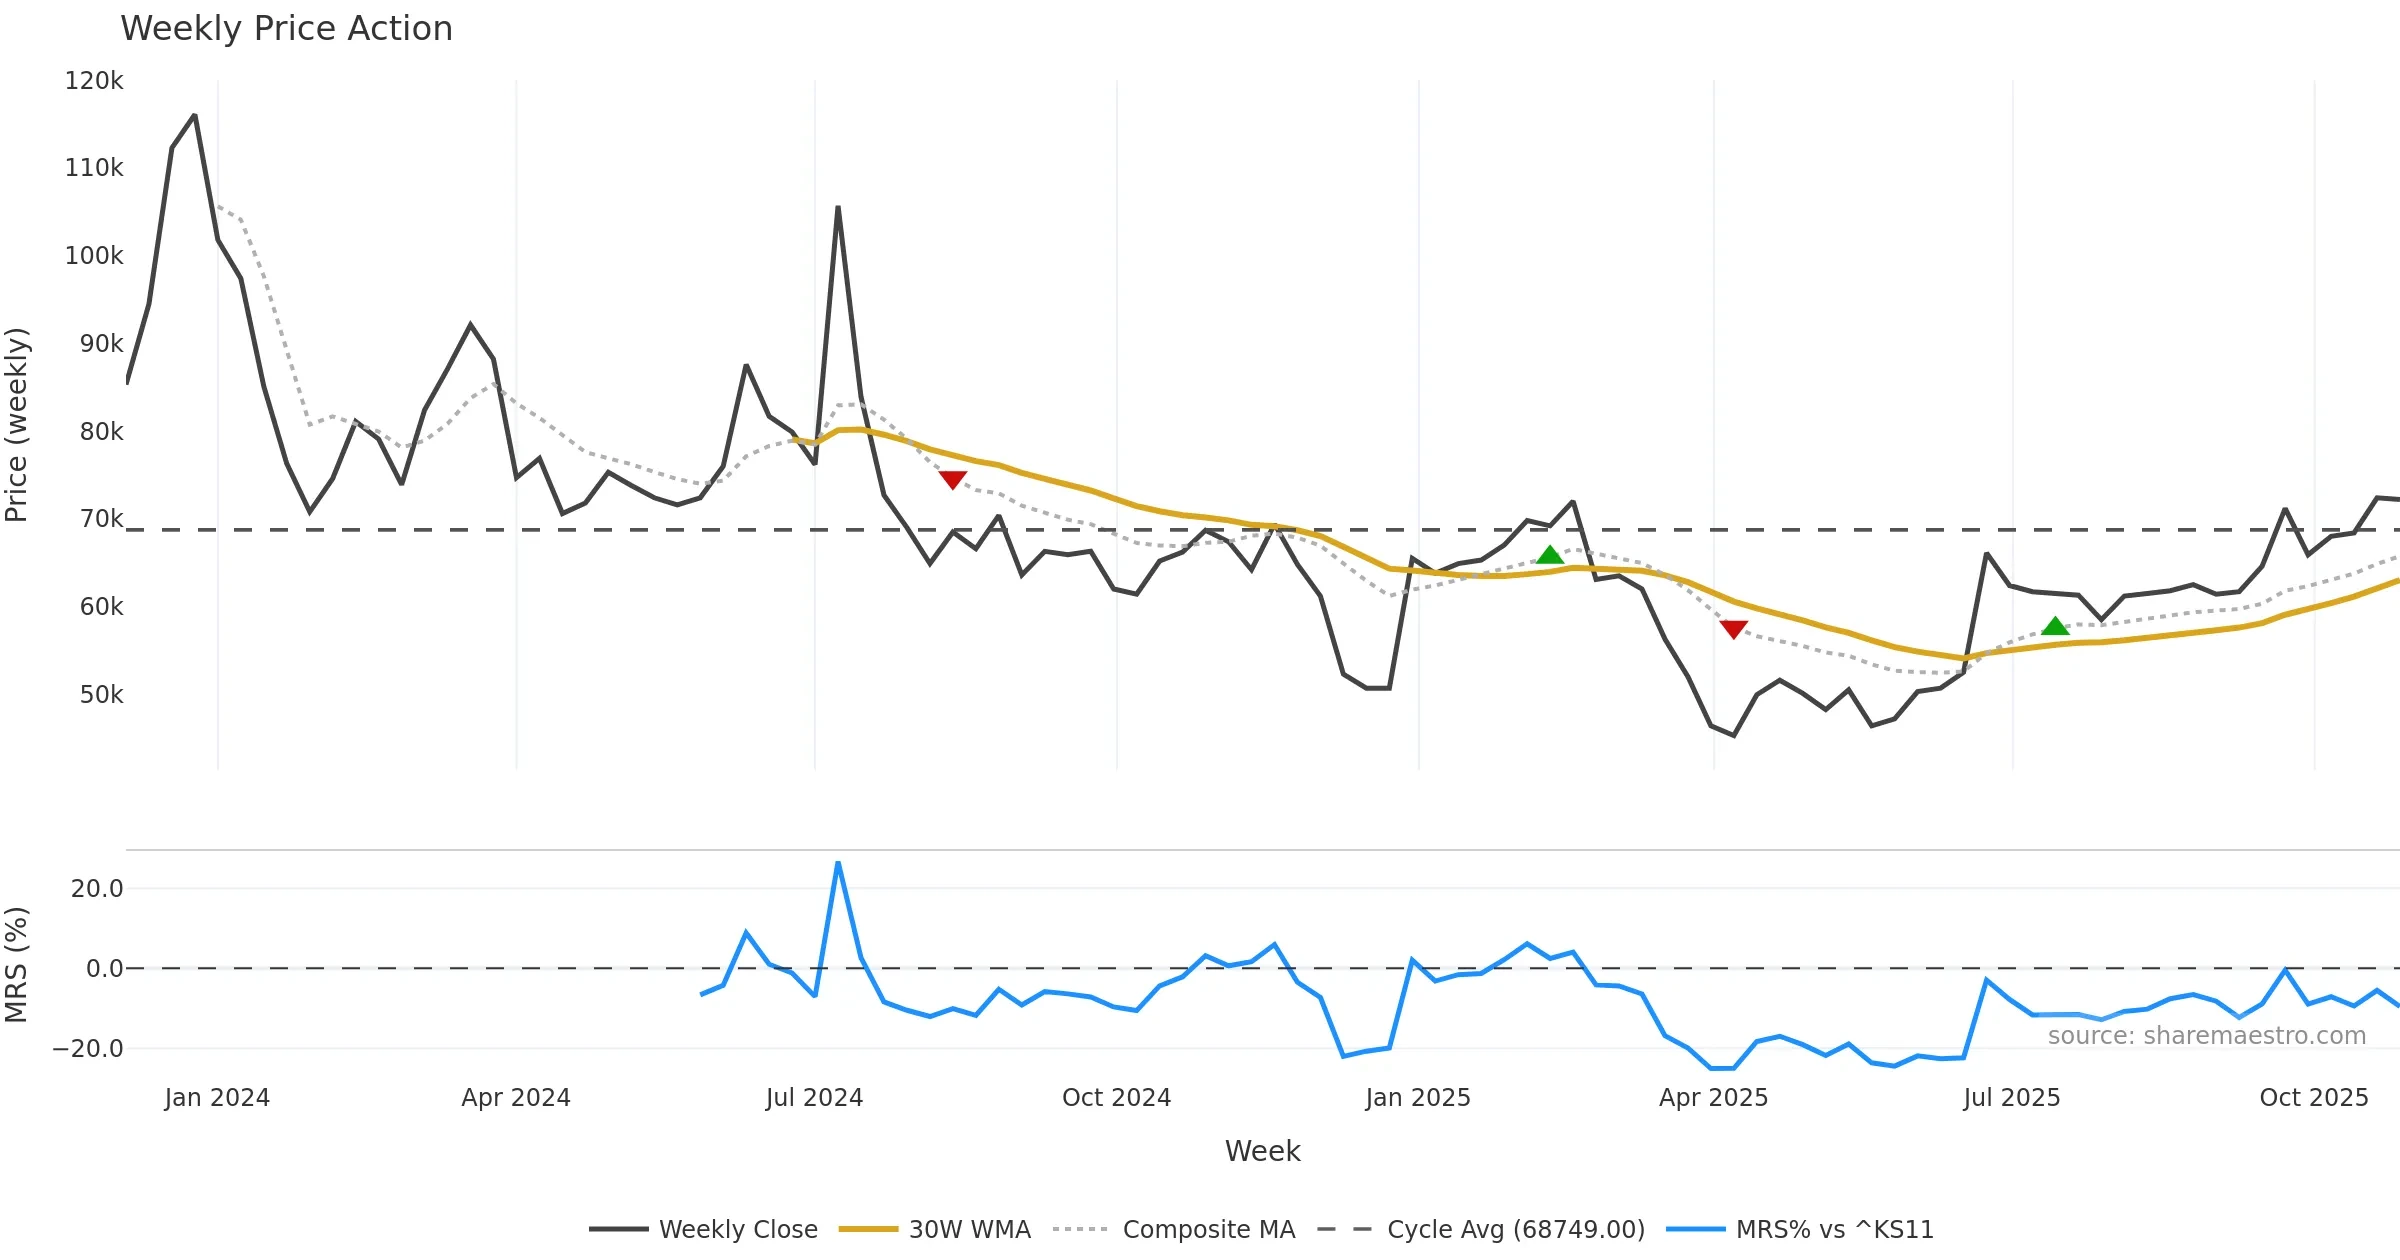
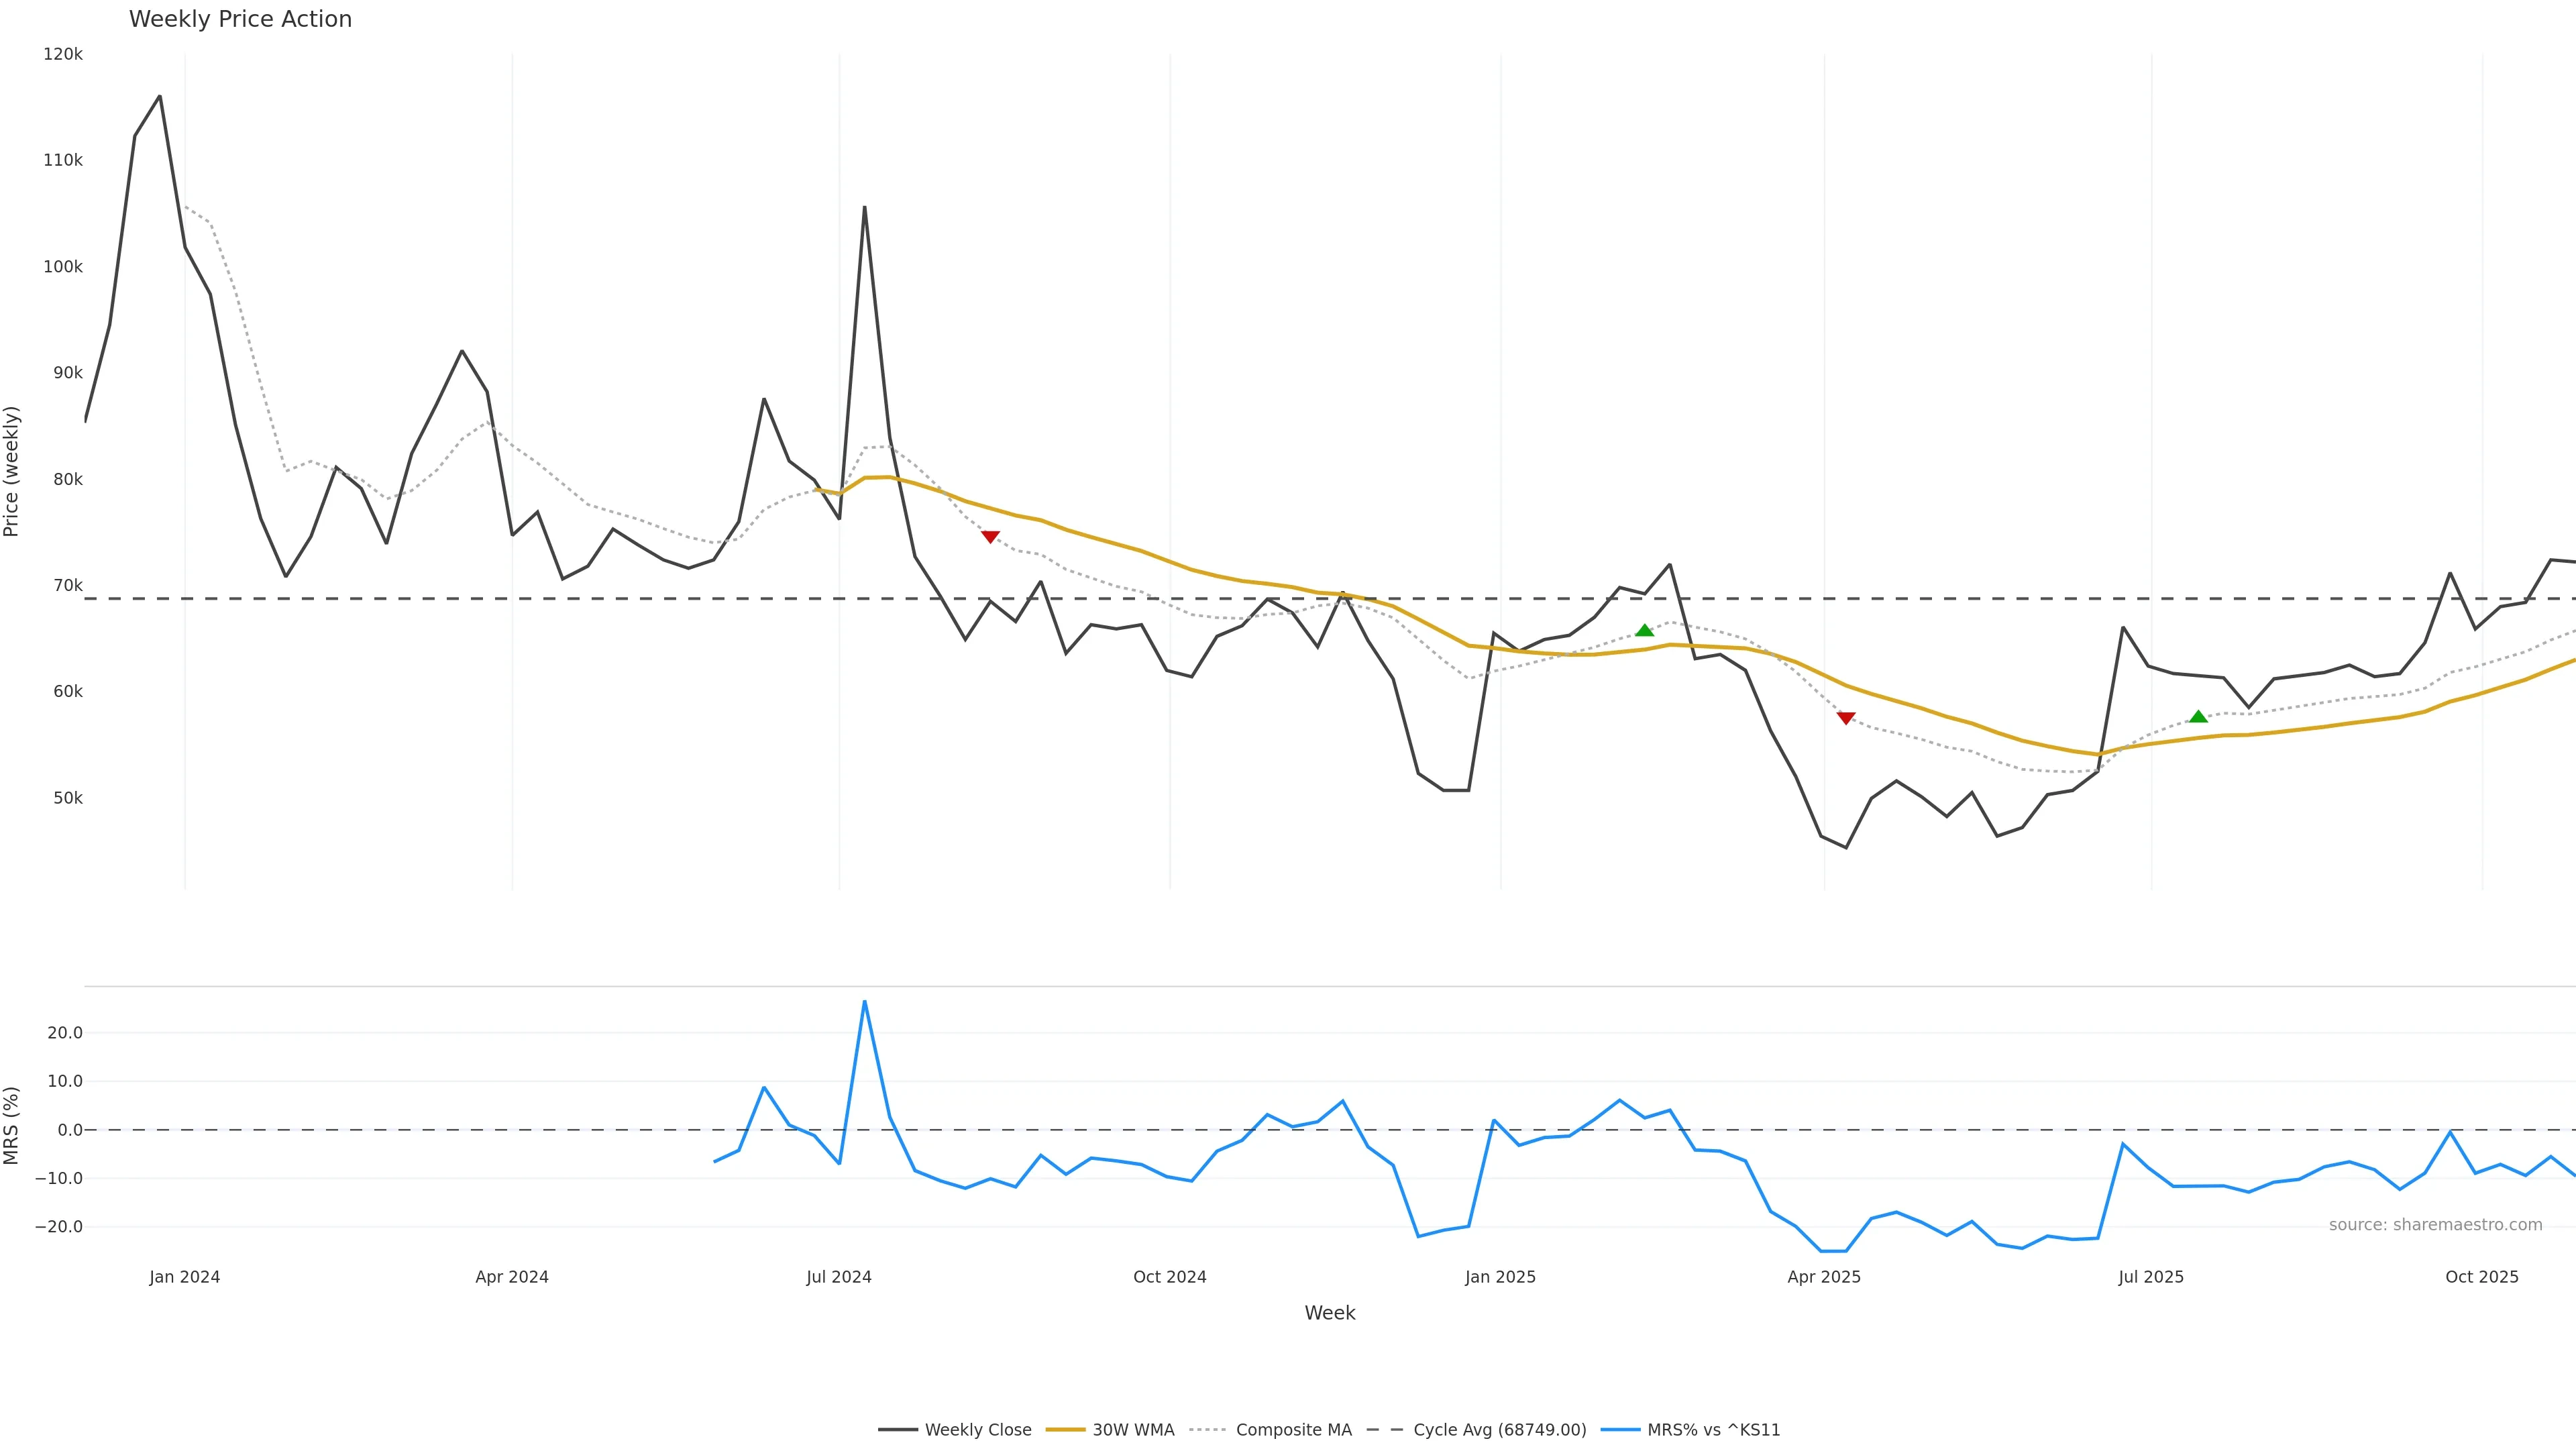
Convergence / Divergence (SI vs Price)
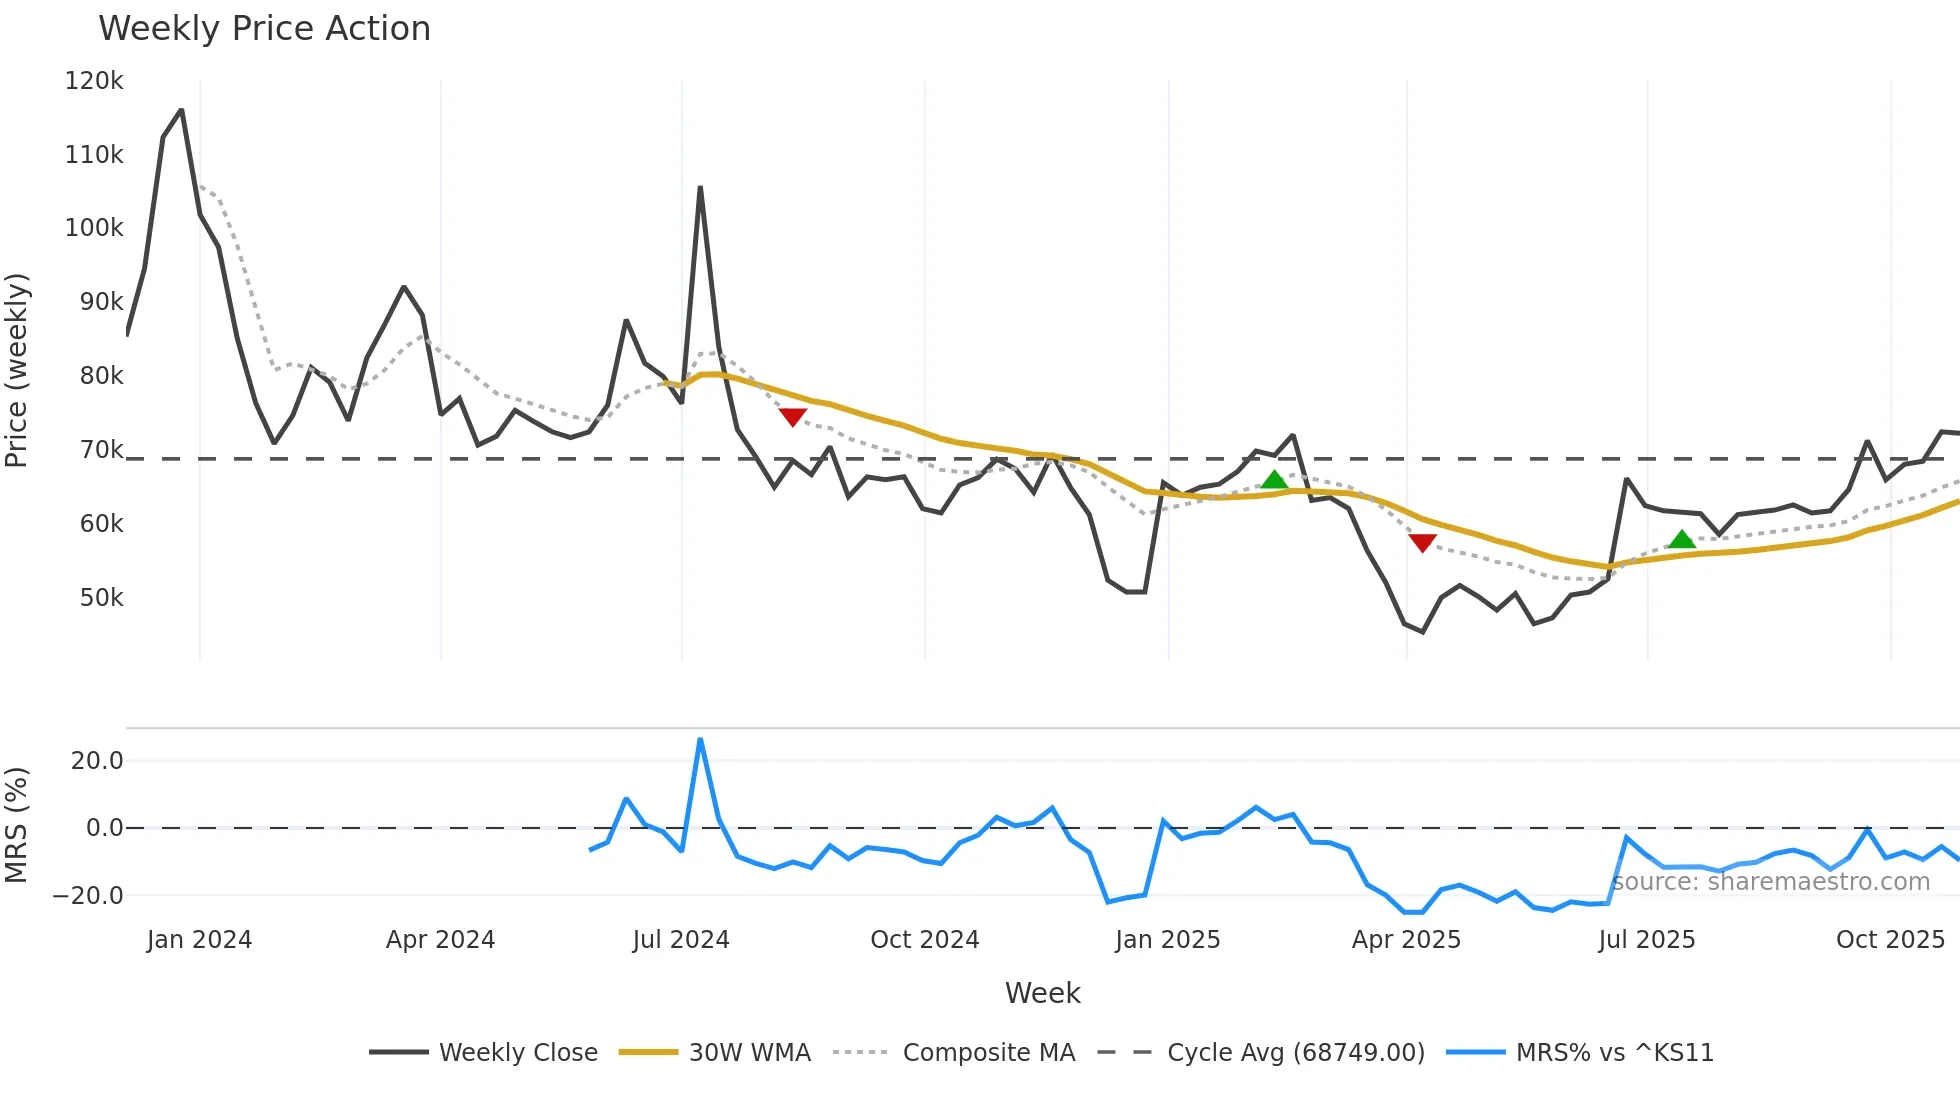
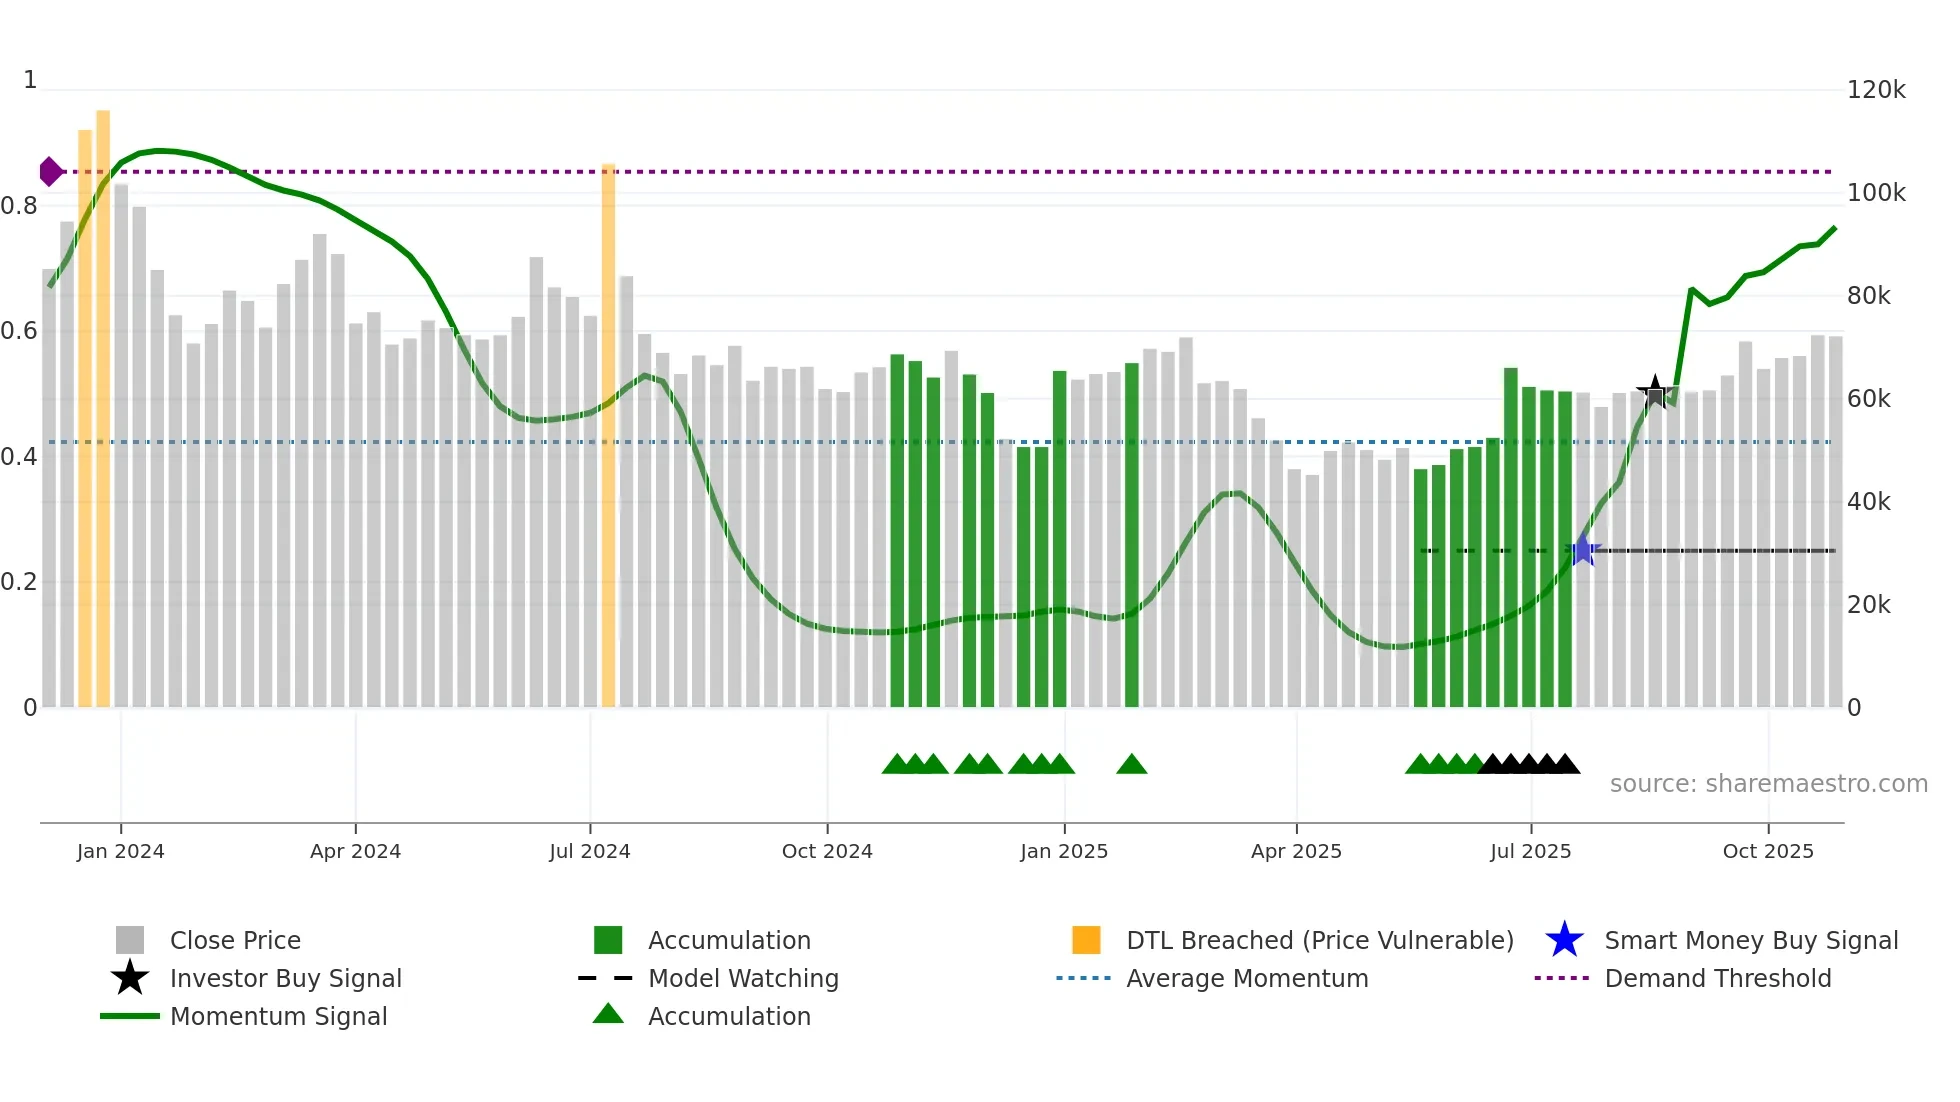
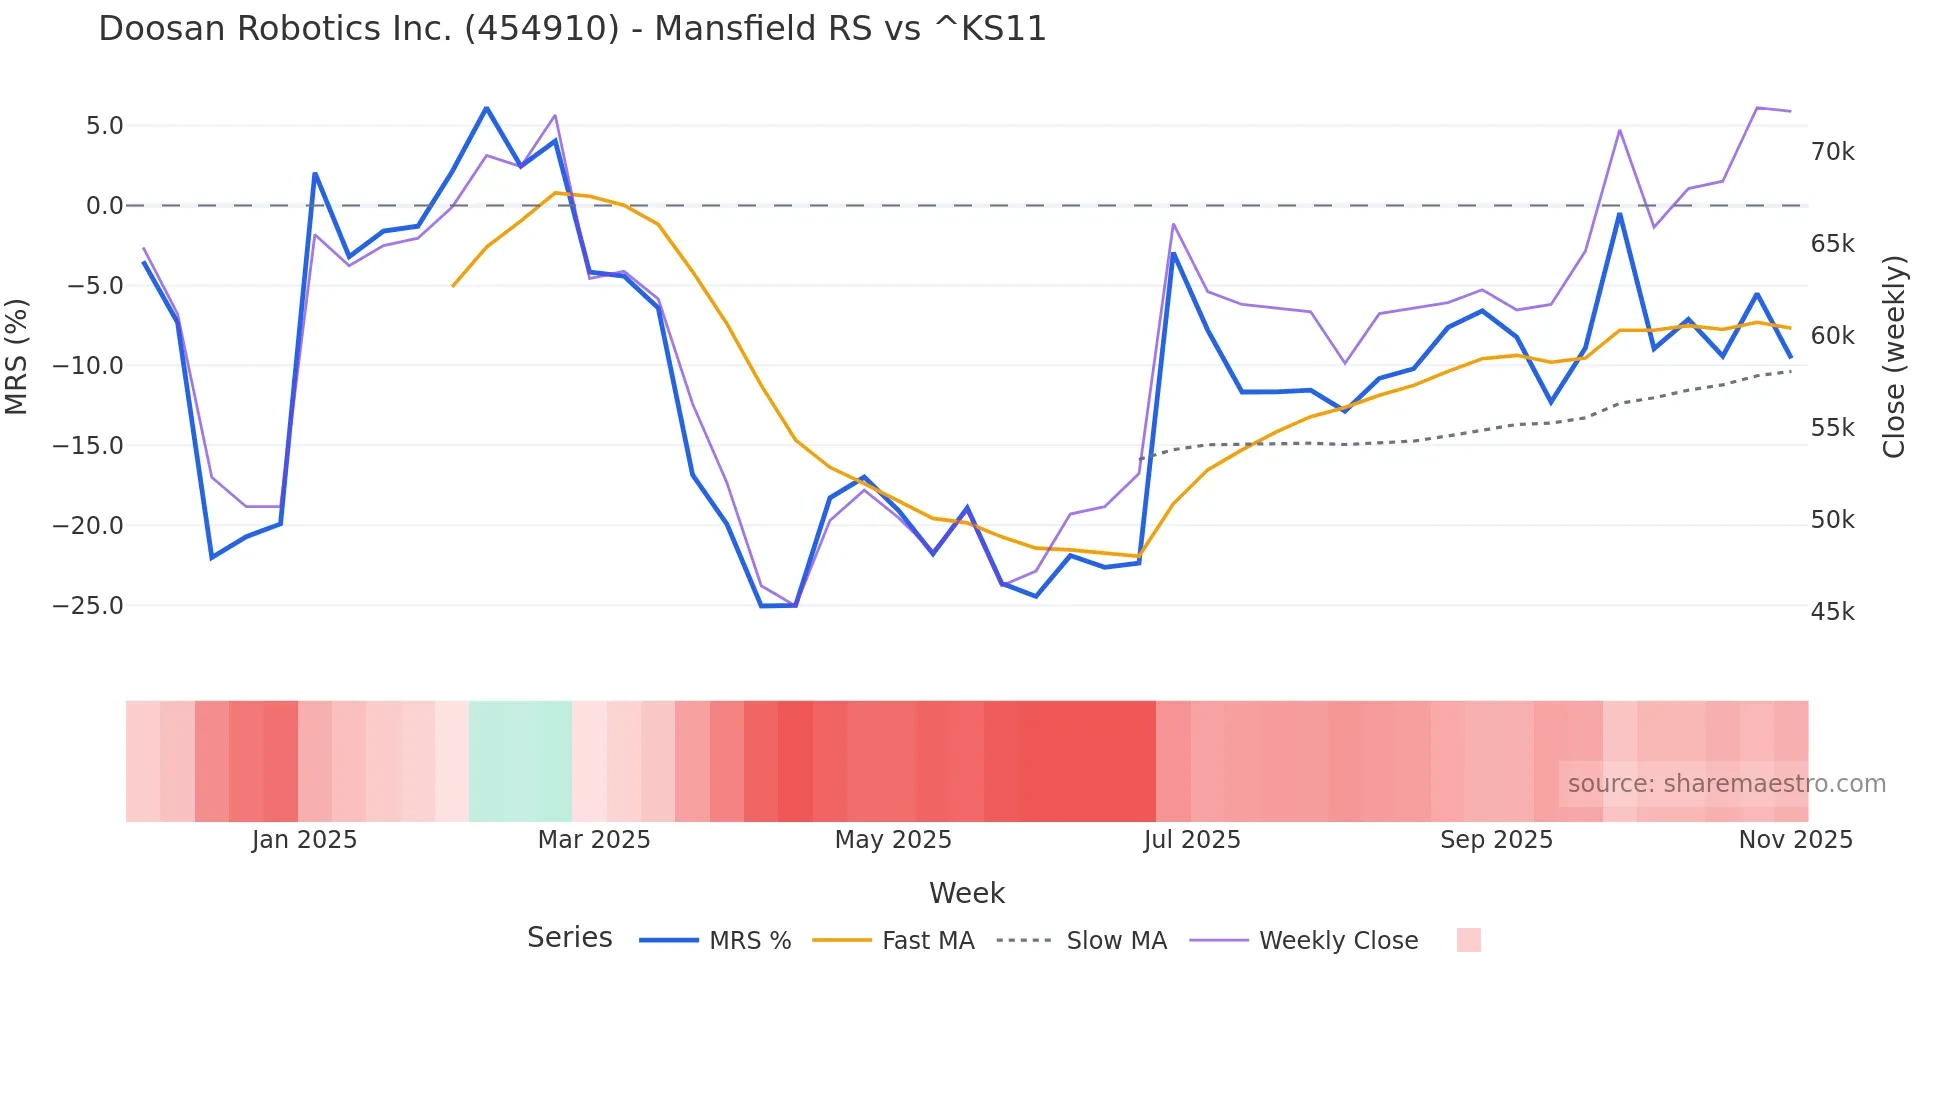
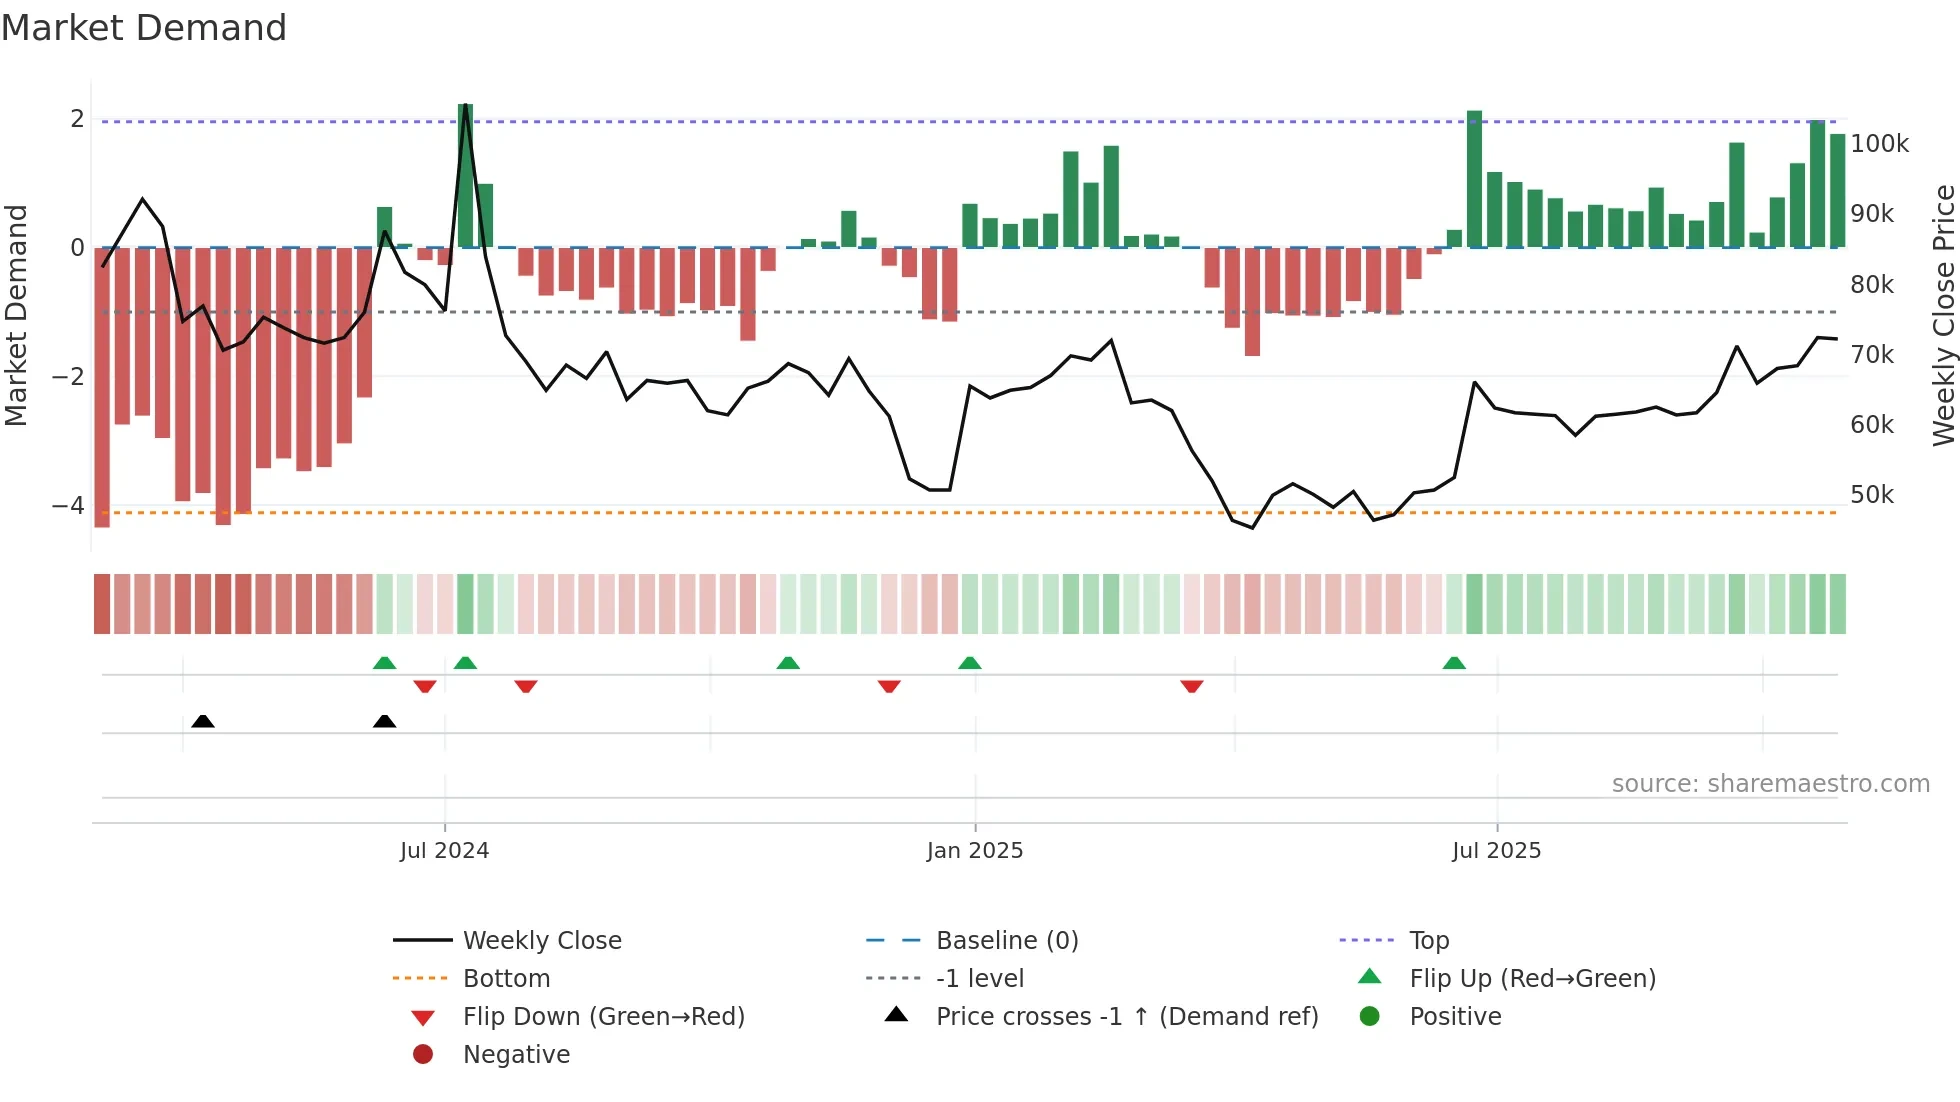
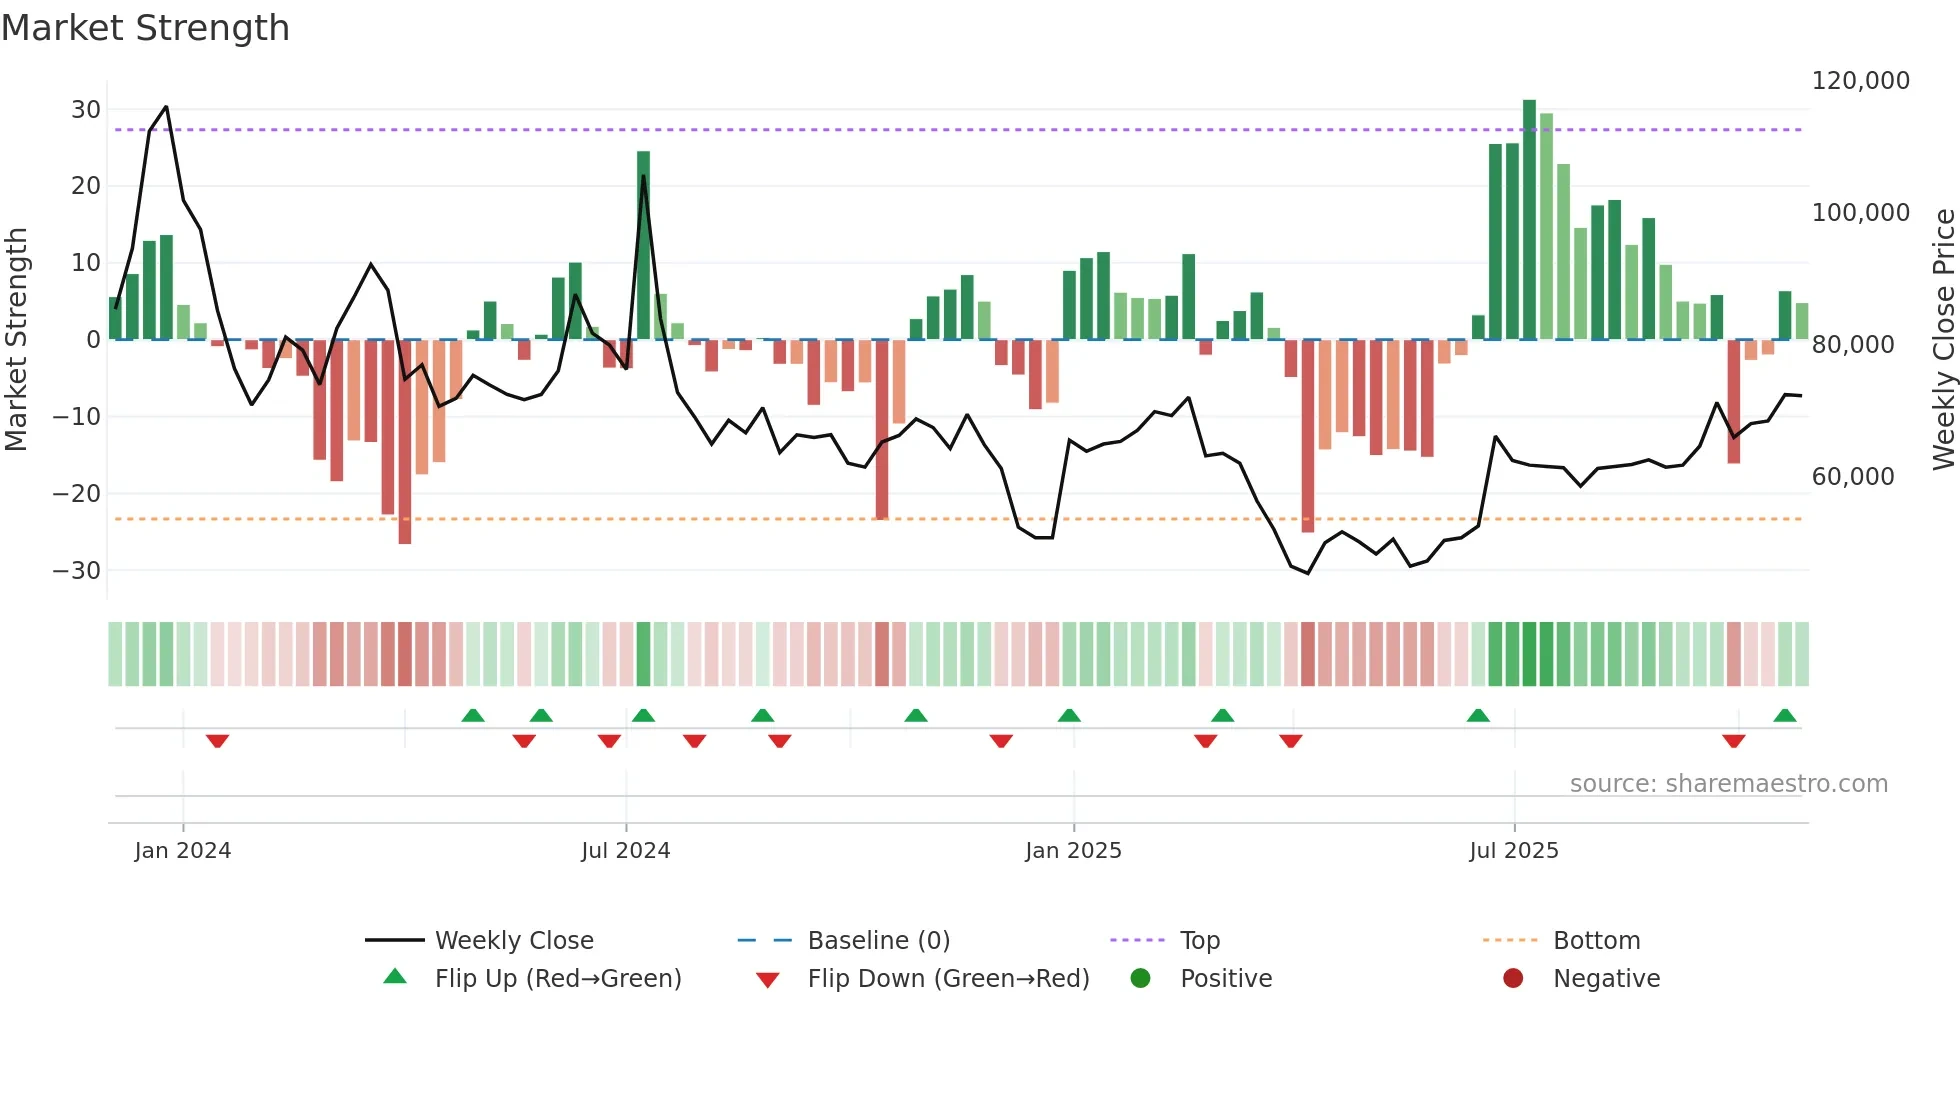
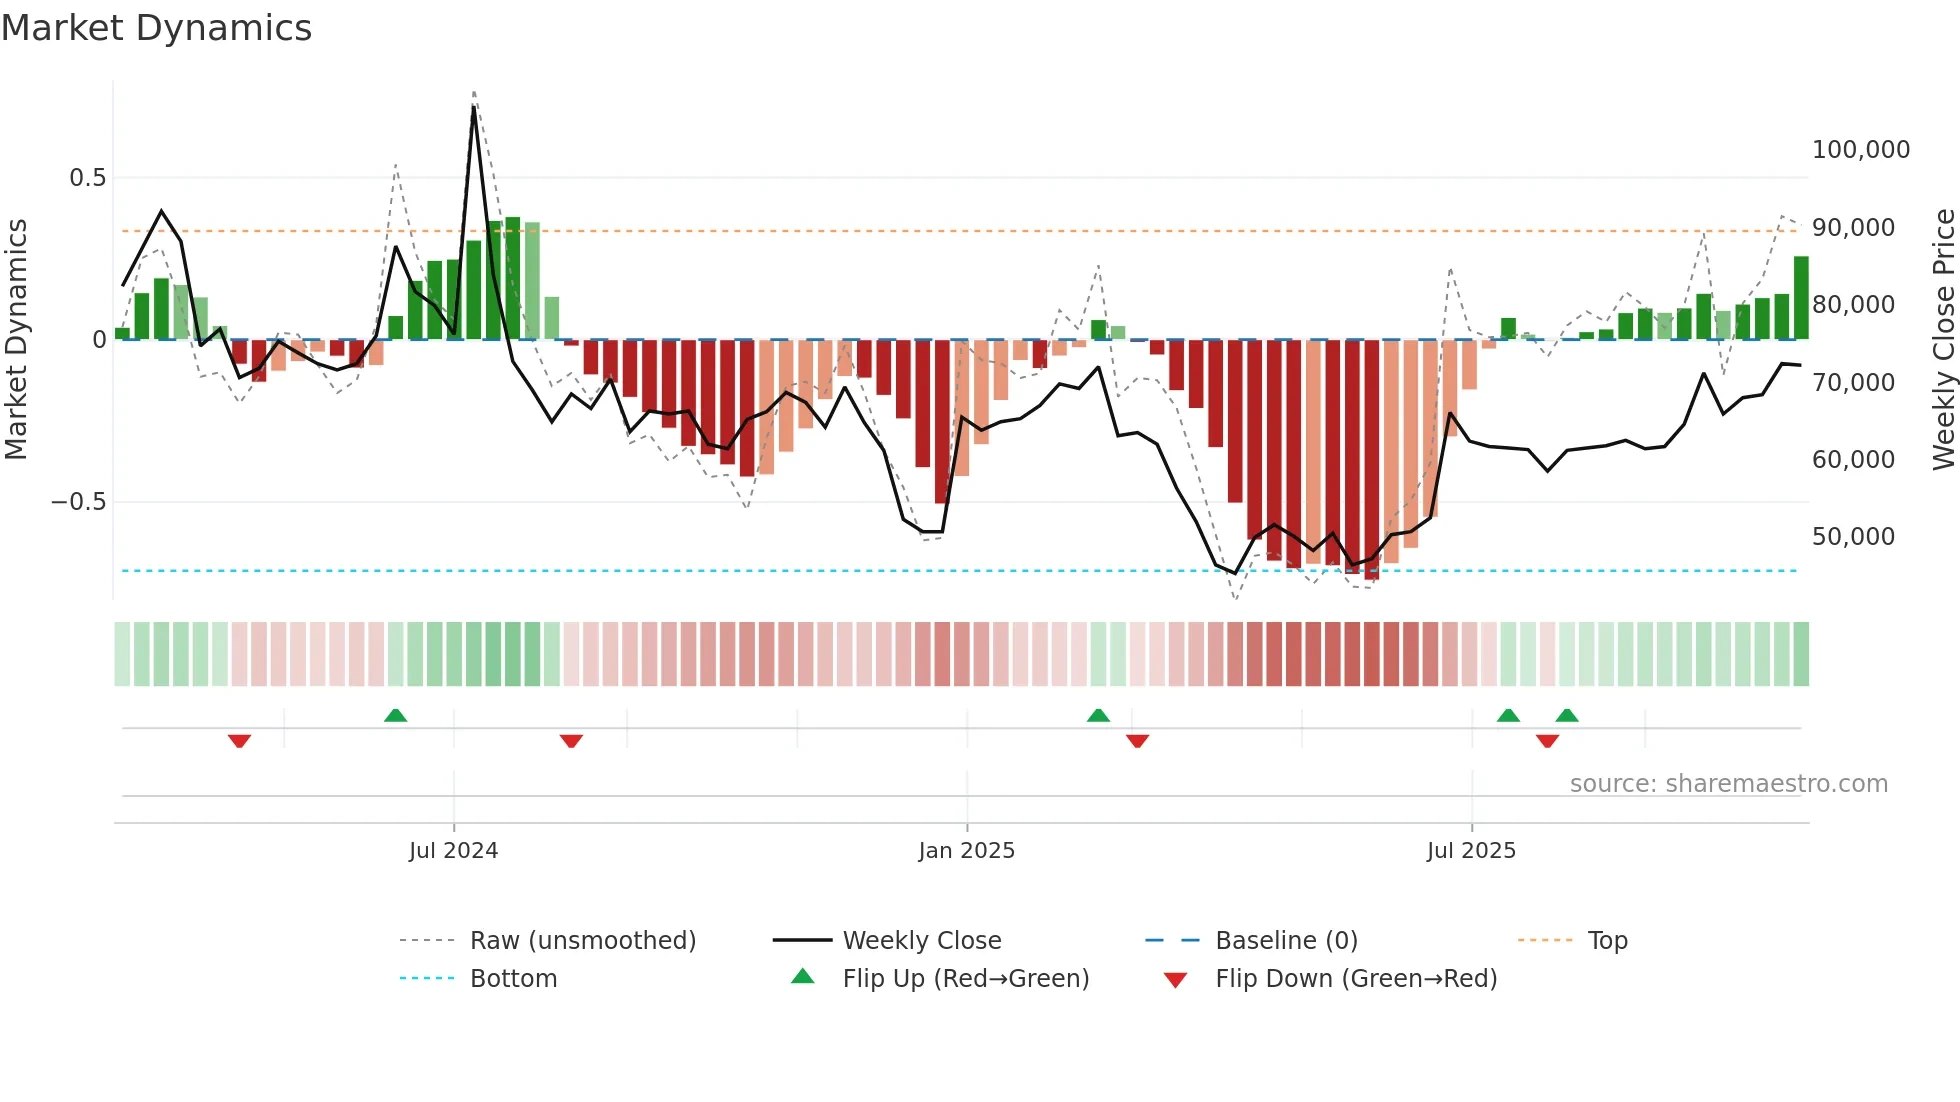
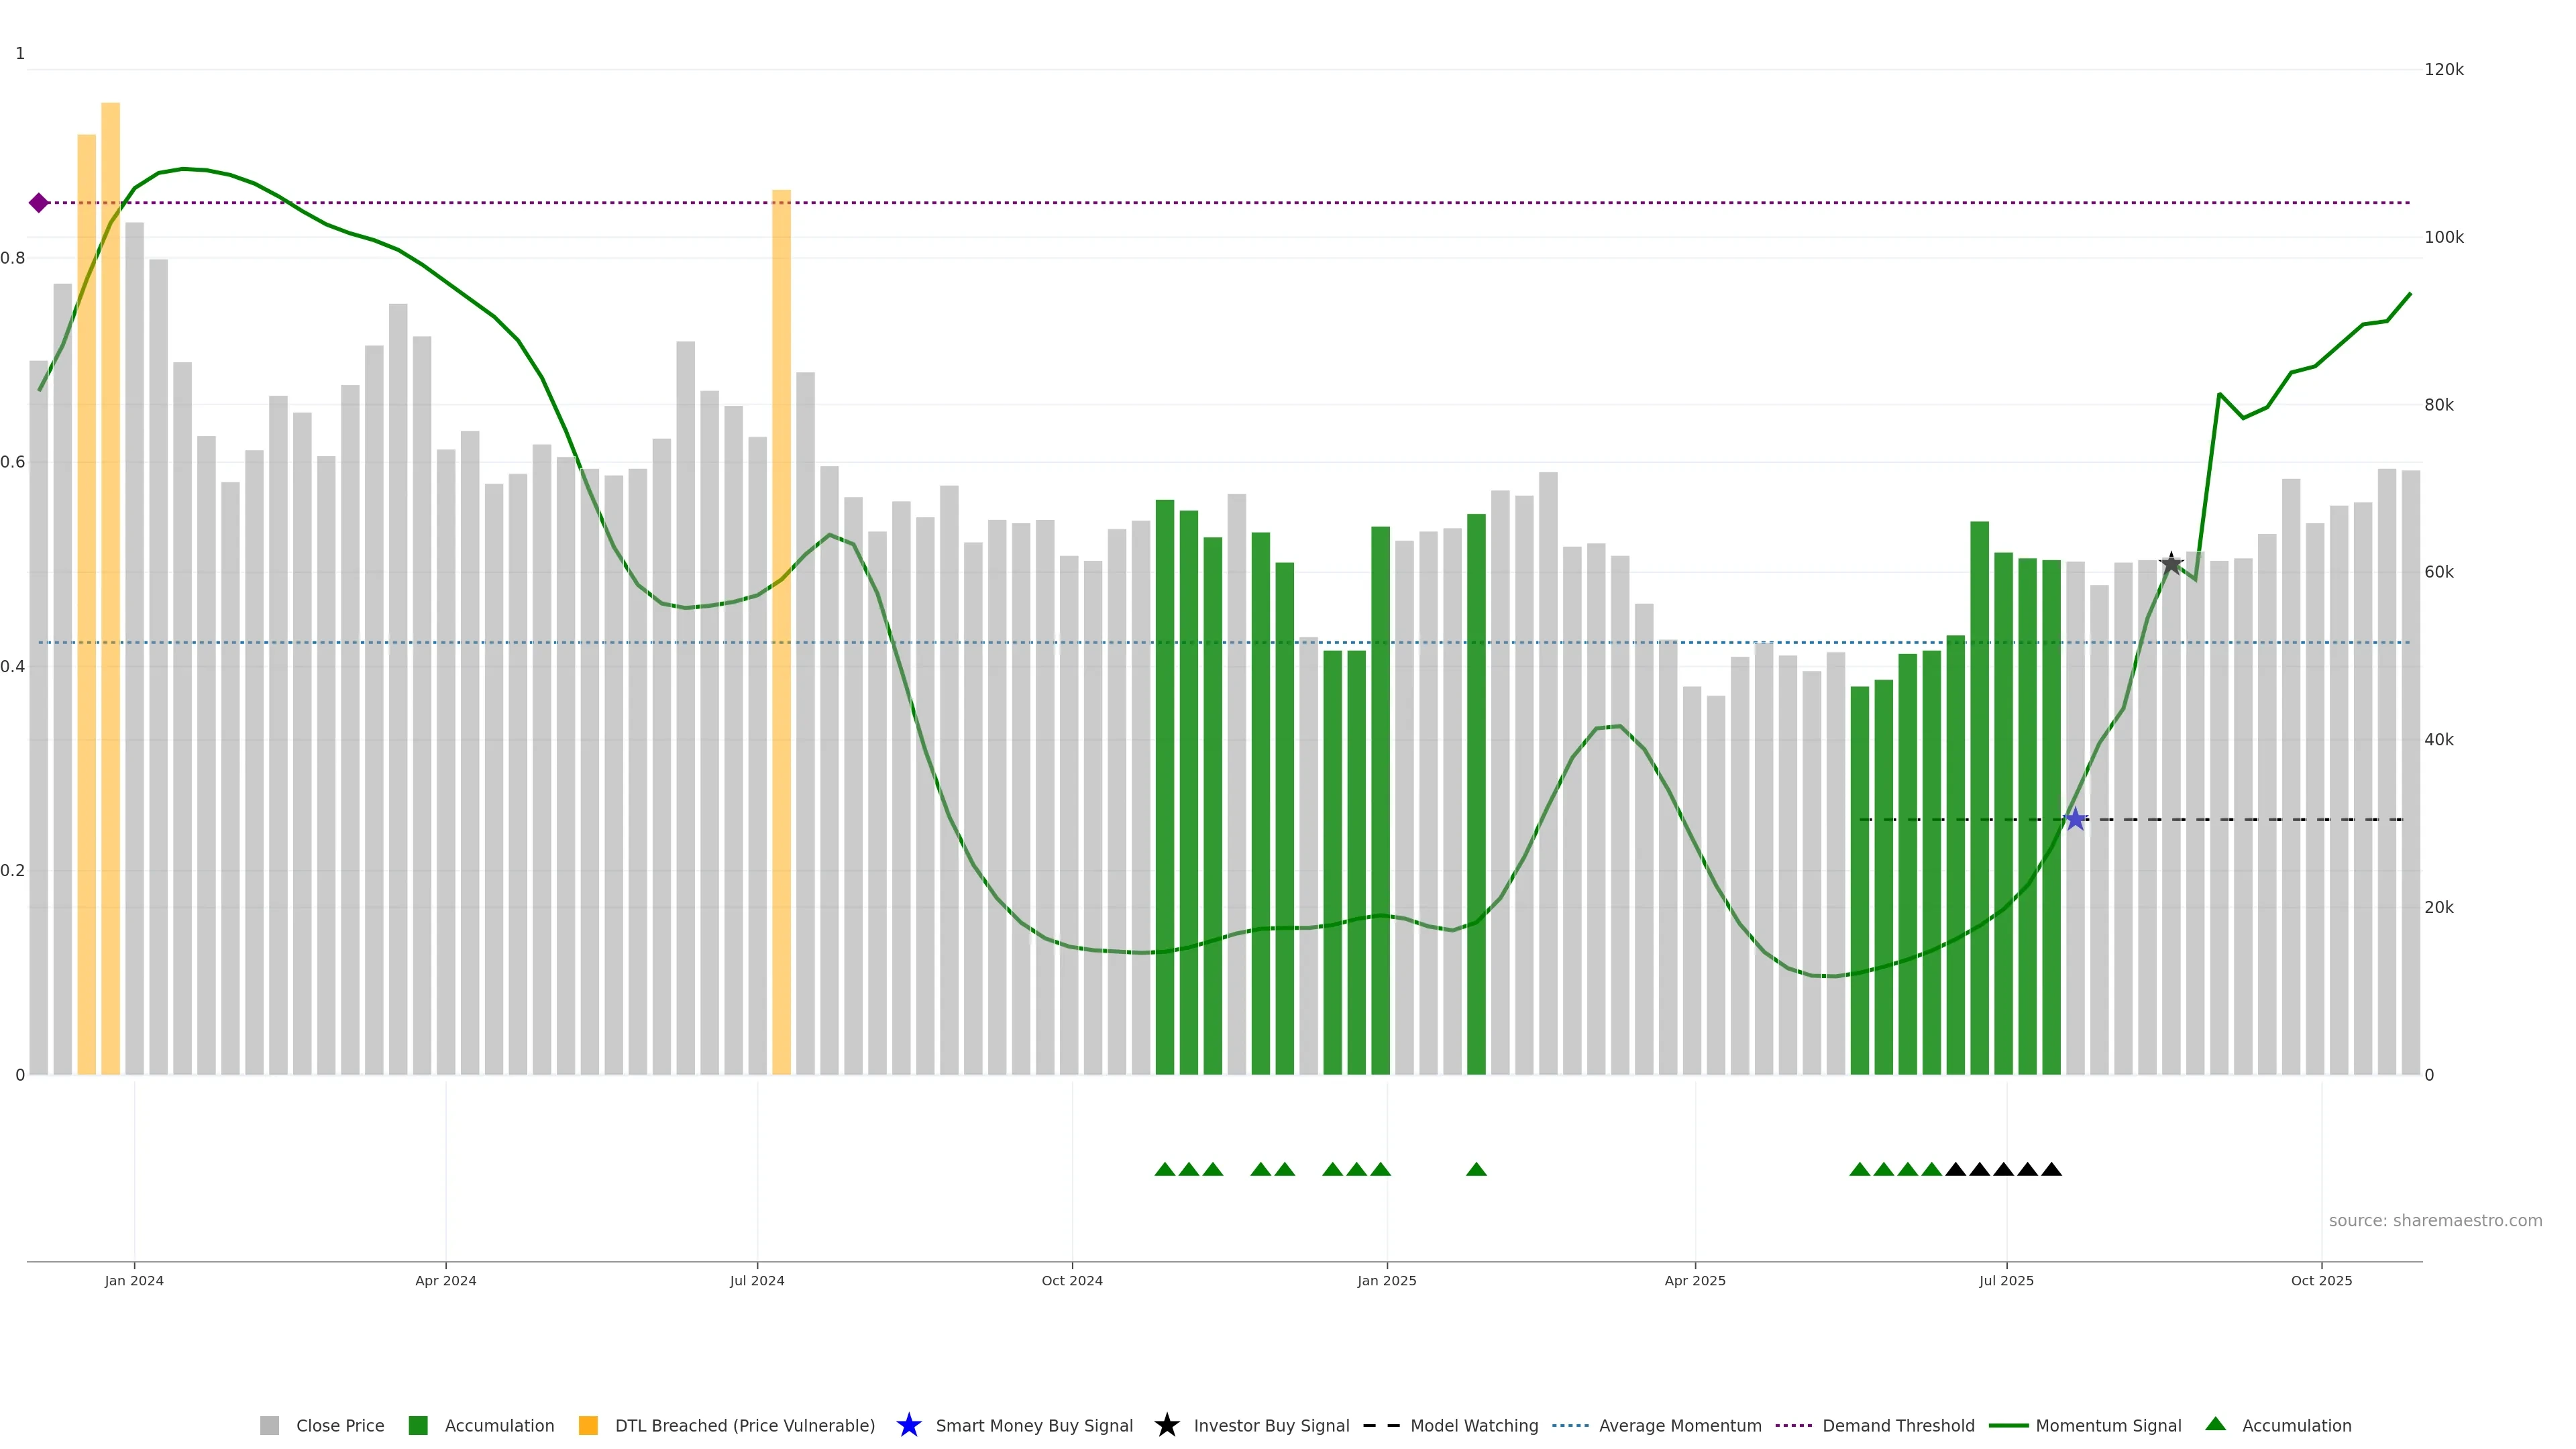
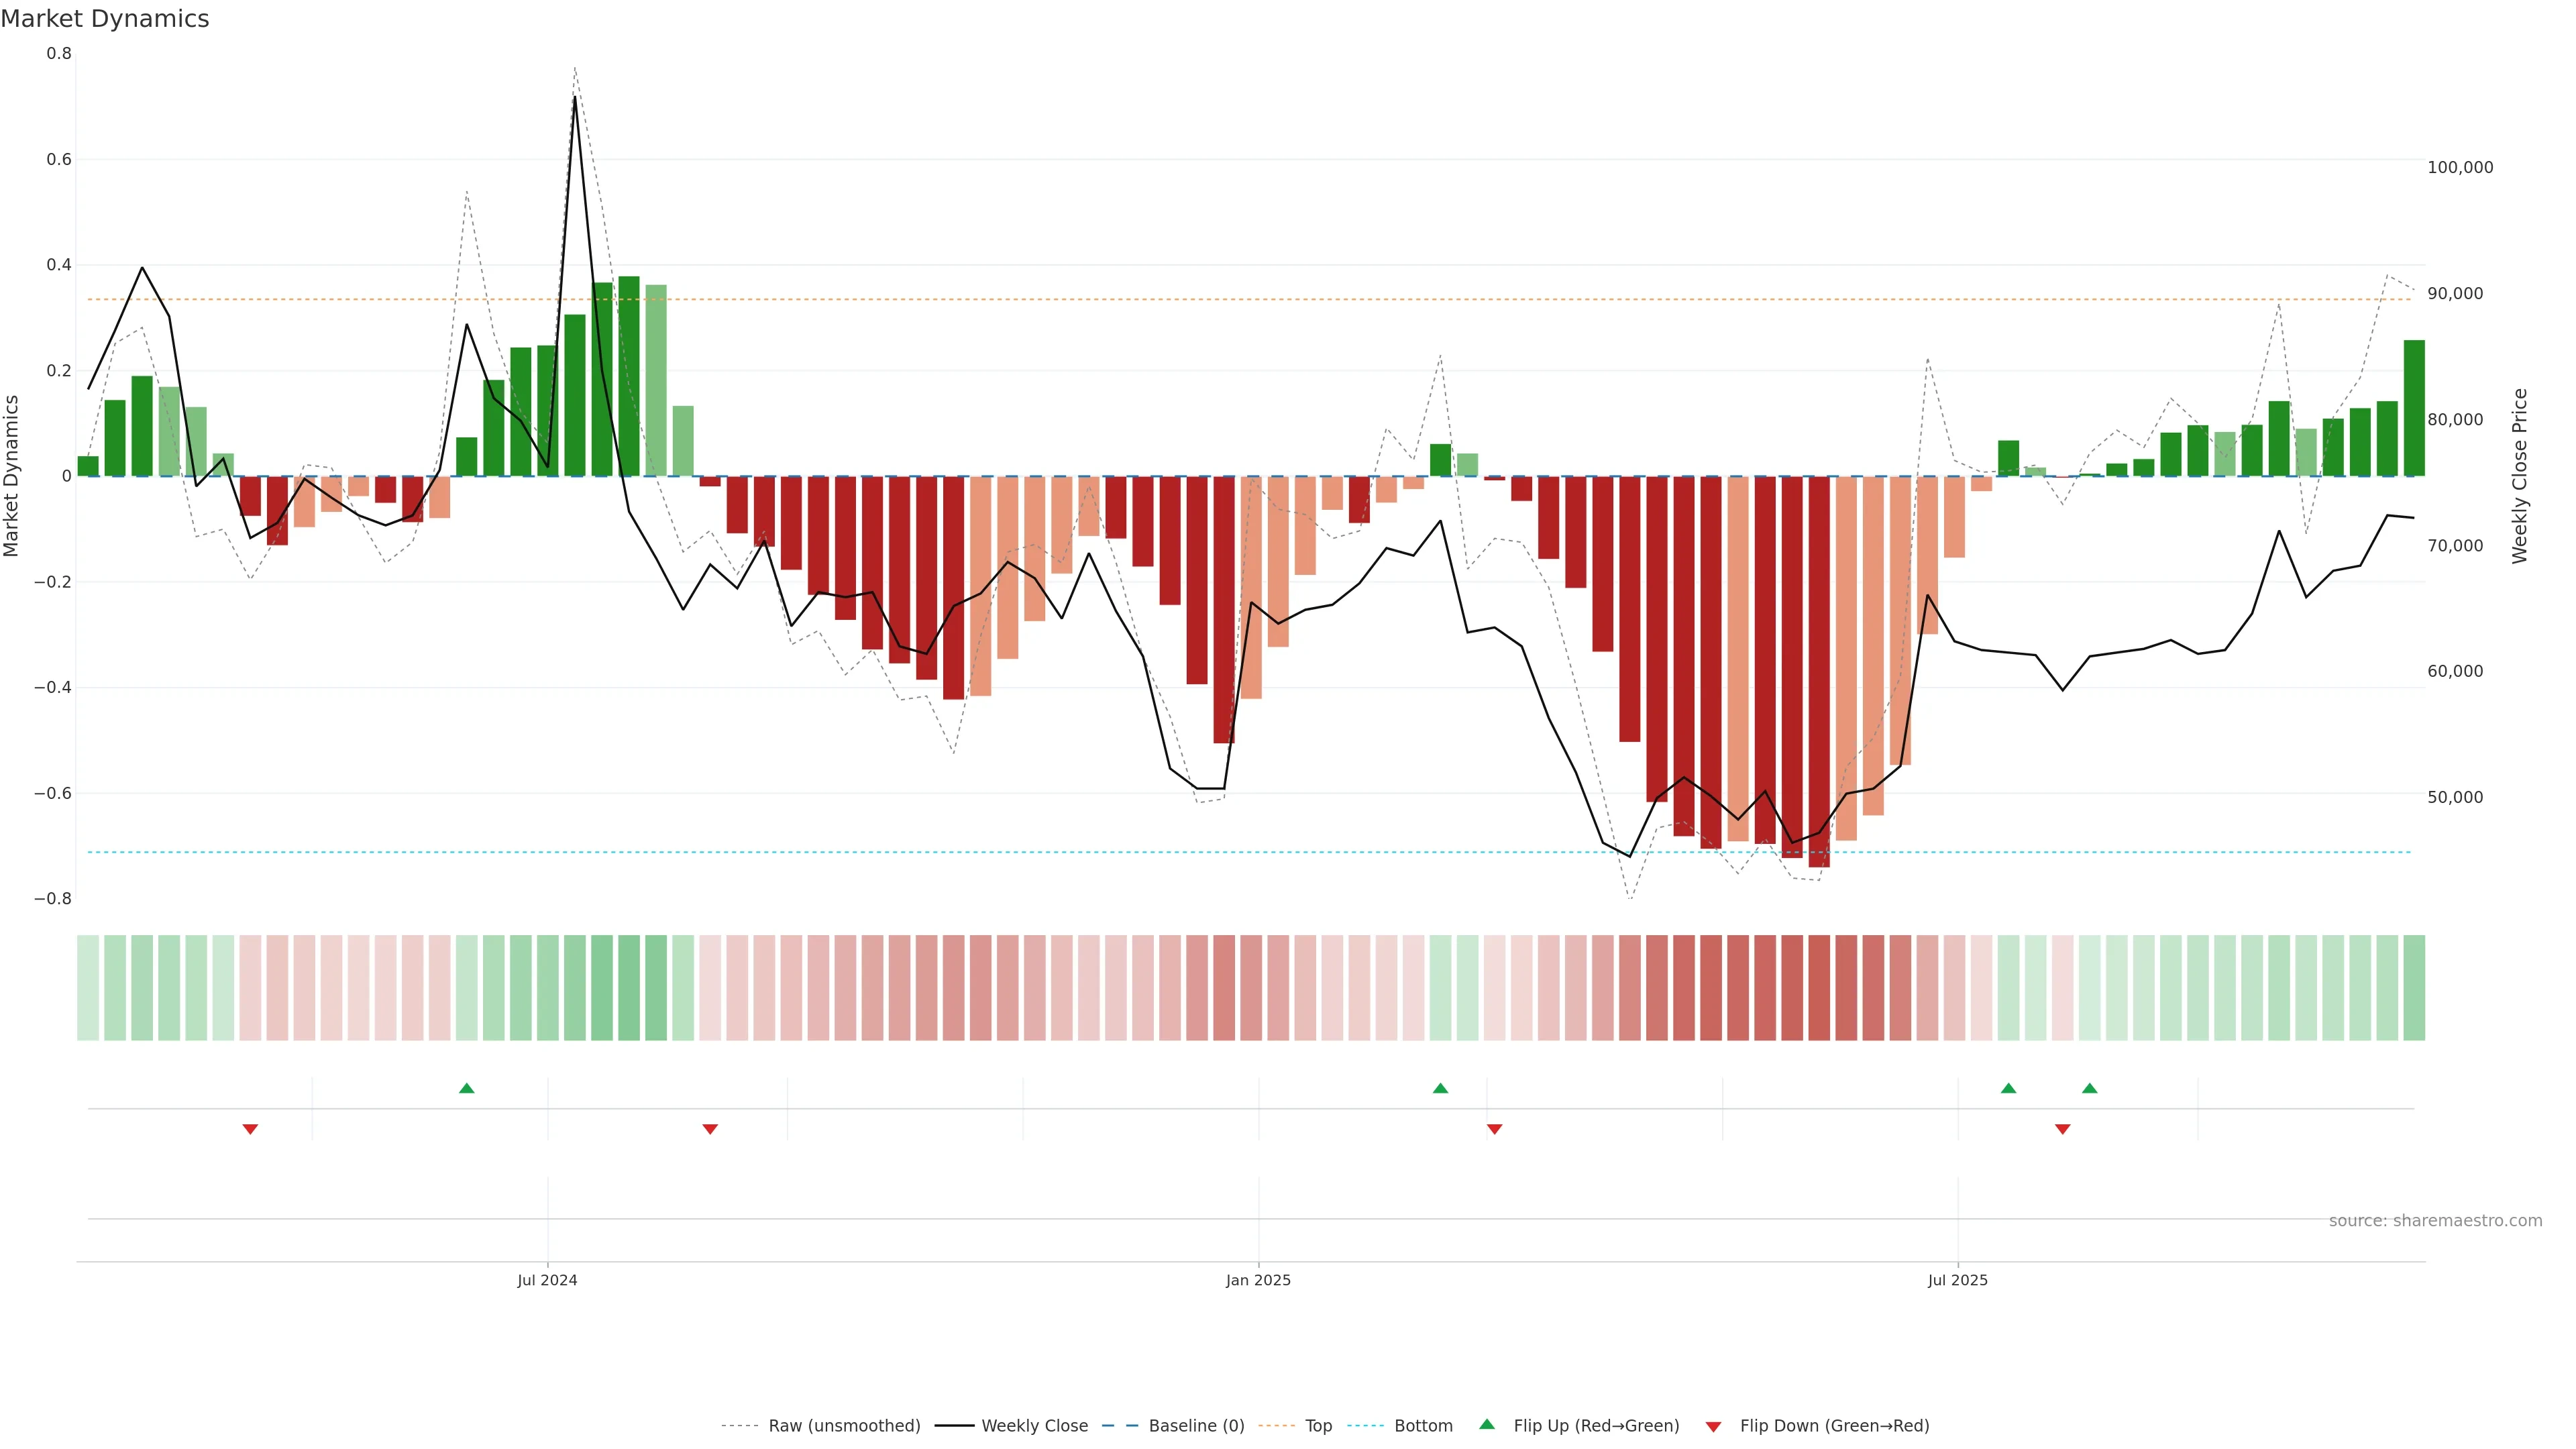
Price and Dynamics are aligned to the upside. — Alignment increases reliability of up-moves.
Score 0.5
+1 / -0
Price and Dynamics are aligned to the upside.
Price and Dynamics are aligned to the upside. Alignment increases reliability of up-moves. In essence this reflects alignment between price and strength/intent with a bullish tilt.
pol 0.5
conf 0.6
moderate · medium
What it means
Price and Dynamics are aligned to the upside. Alignment increases reliability of up-moves. In essence this reflects alignment between price and strength/intent with a bullish tilt.
Implications
Improves odds for follow-through if pullbacks hold higher lows. (pol 0.50, conf 0.60 → moderate/medium)
No additional observations.