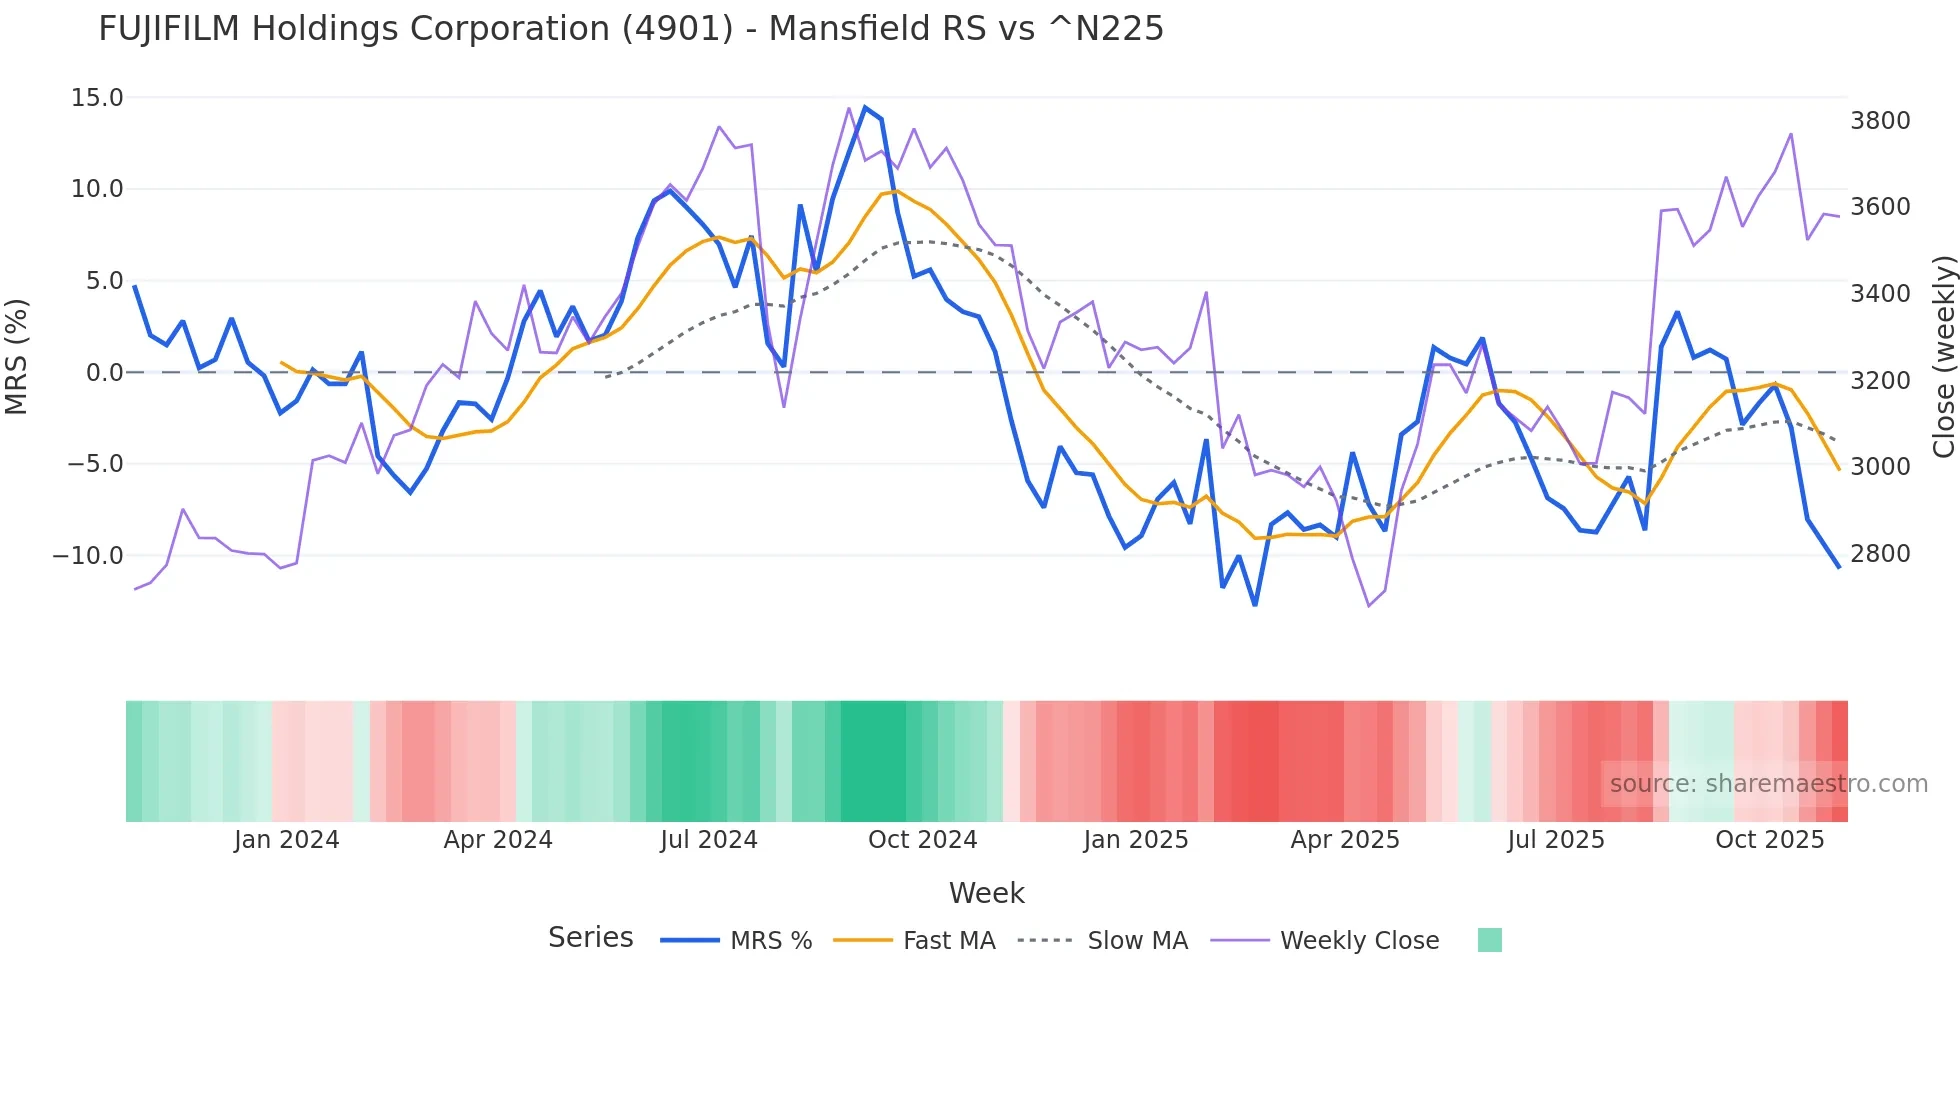
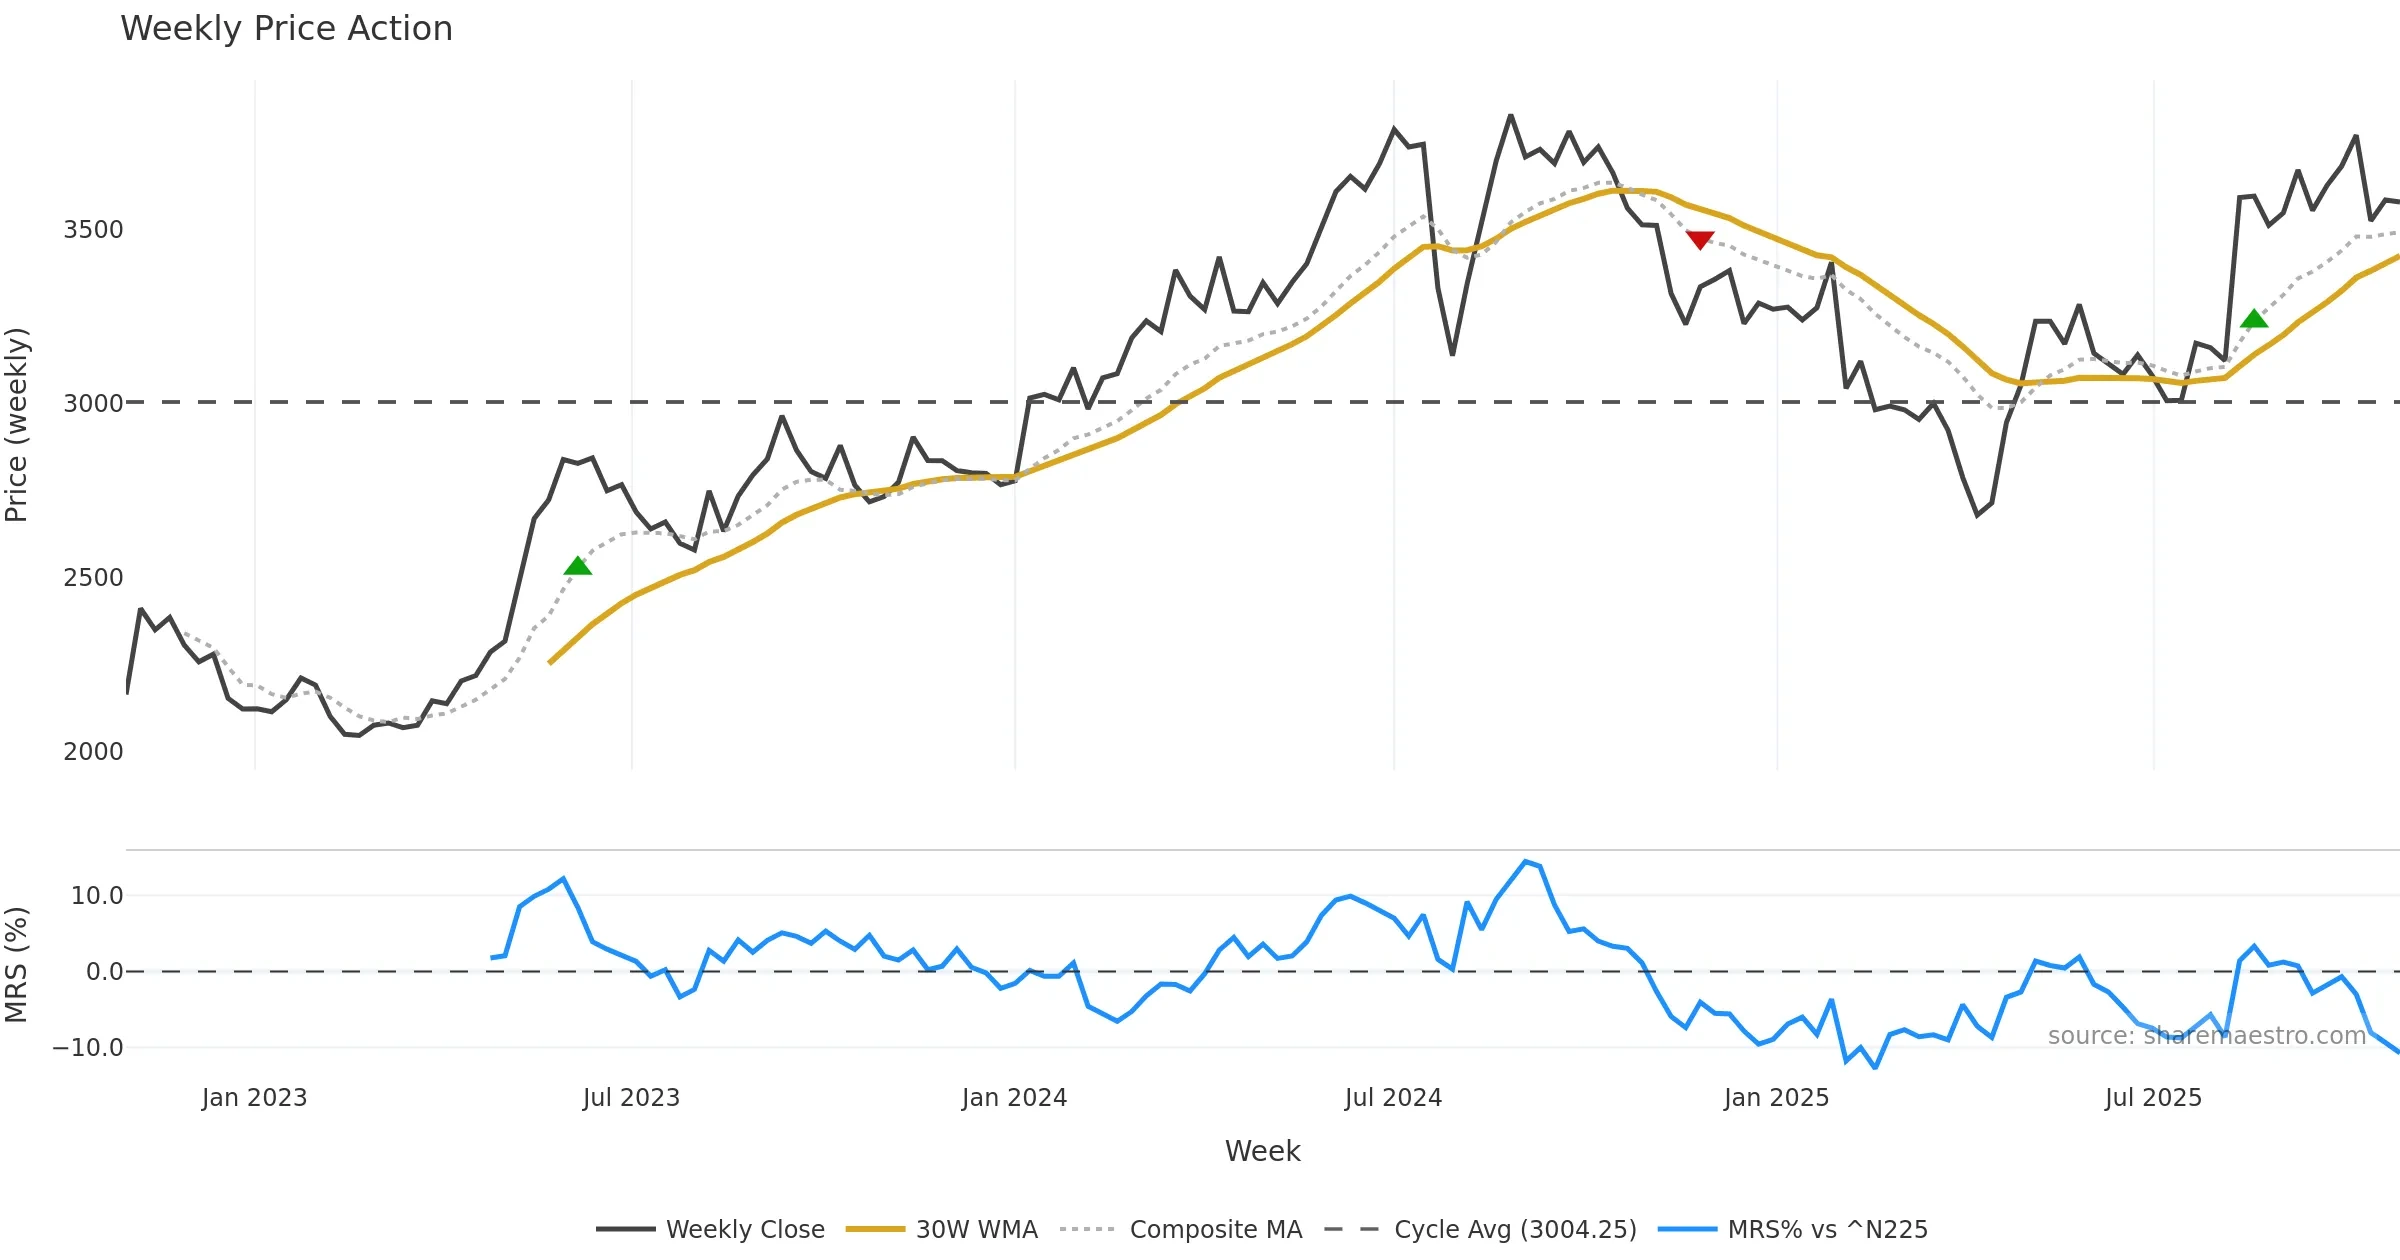
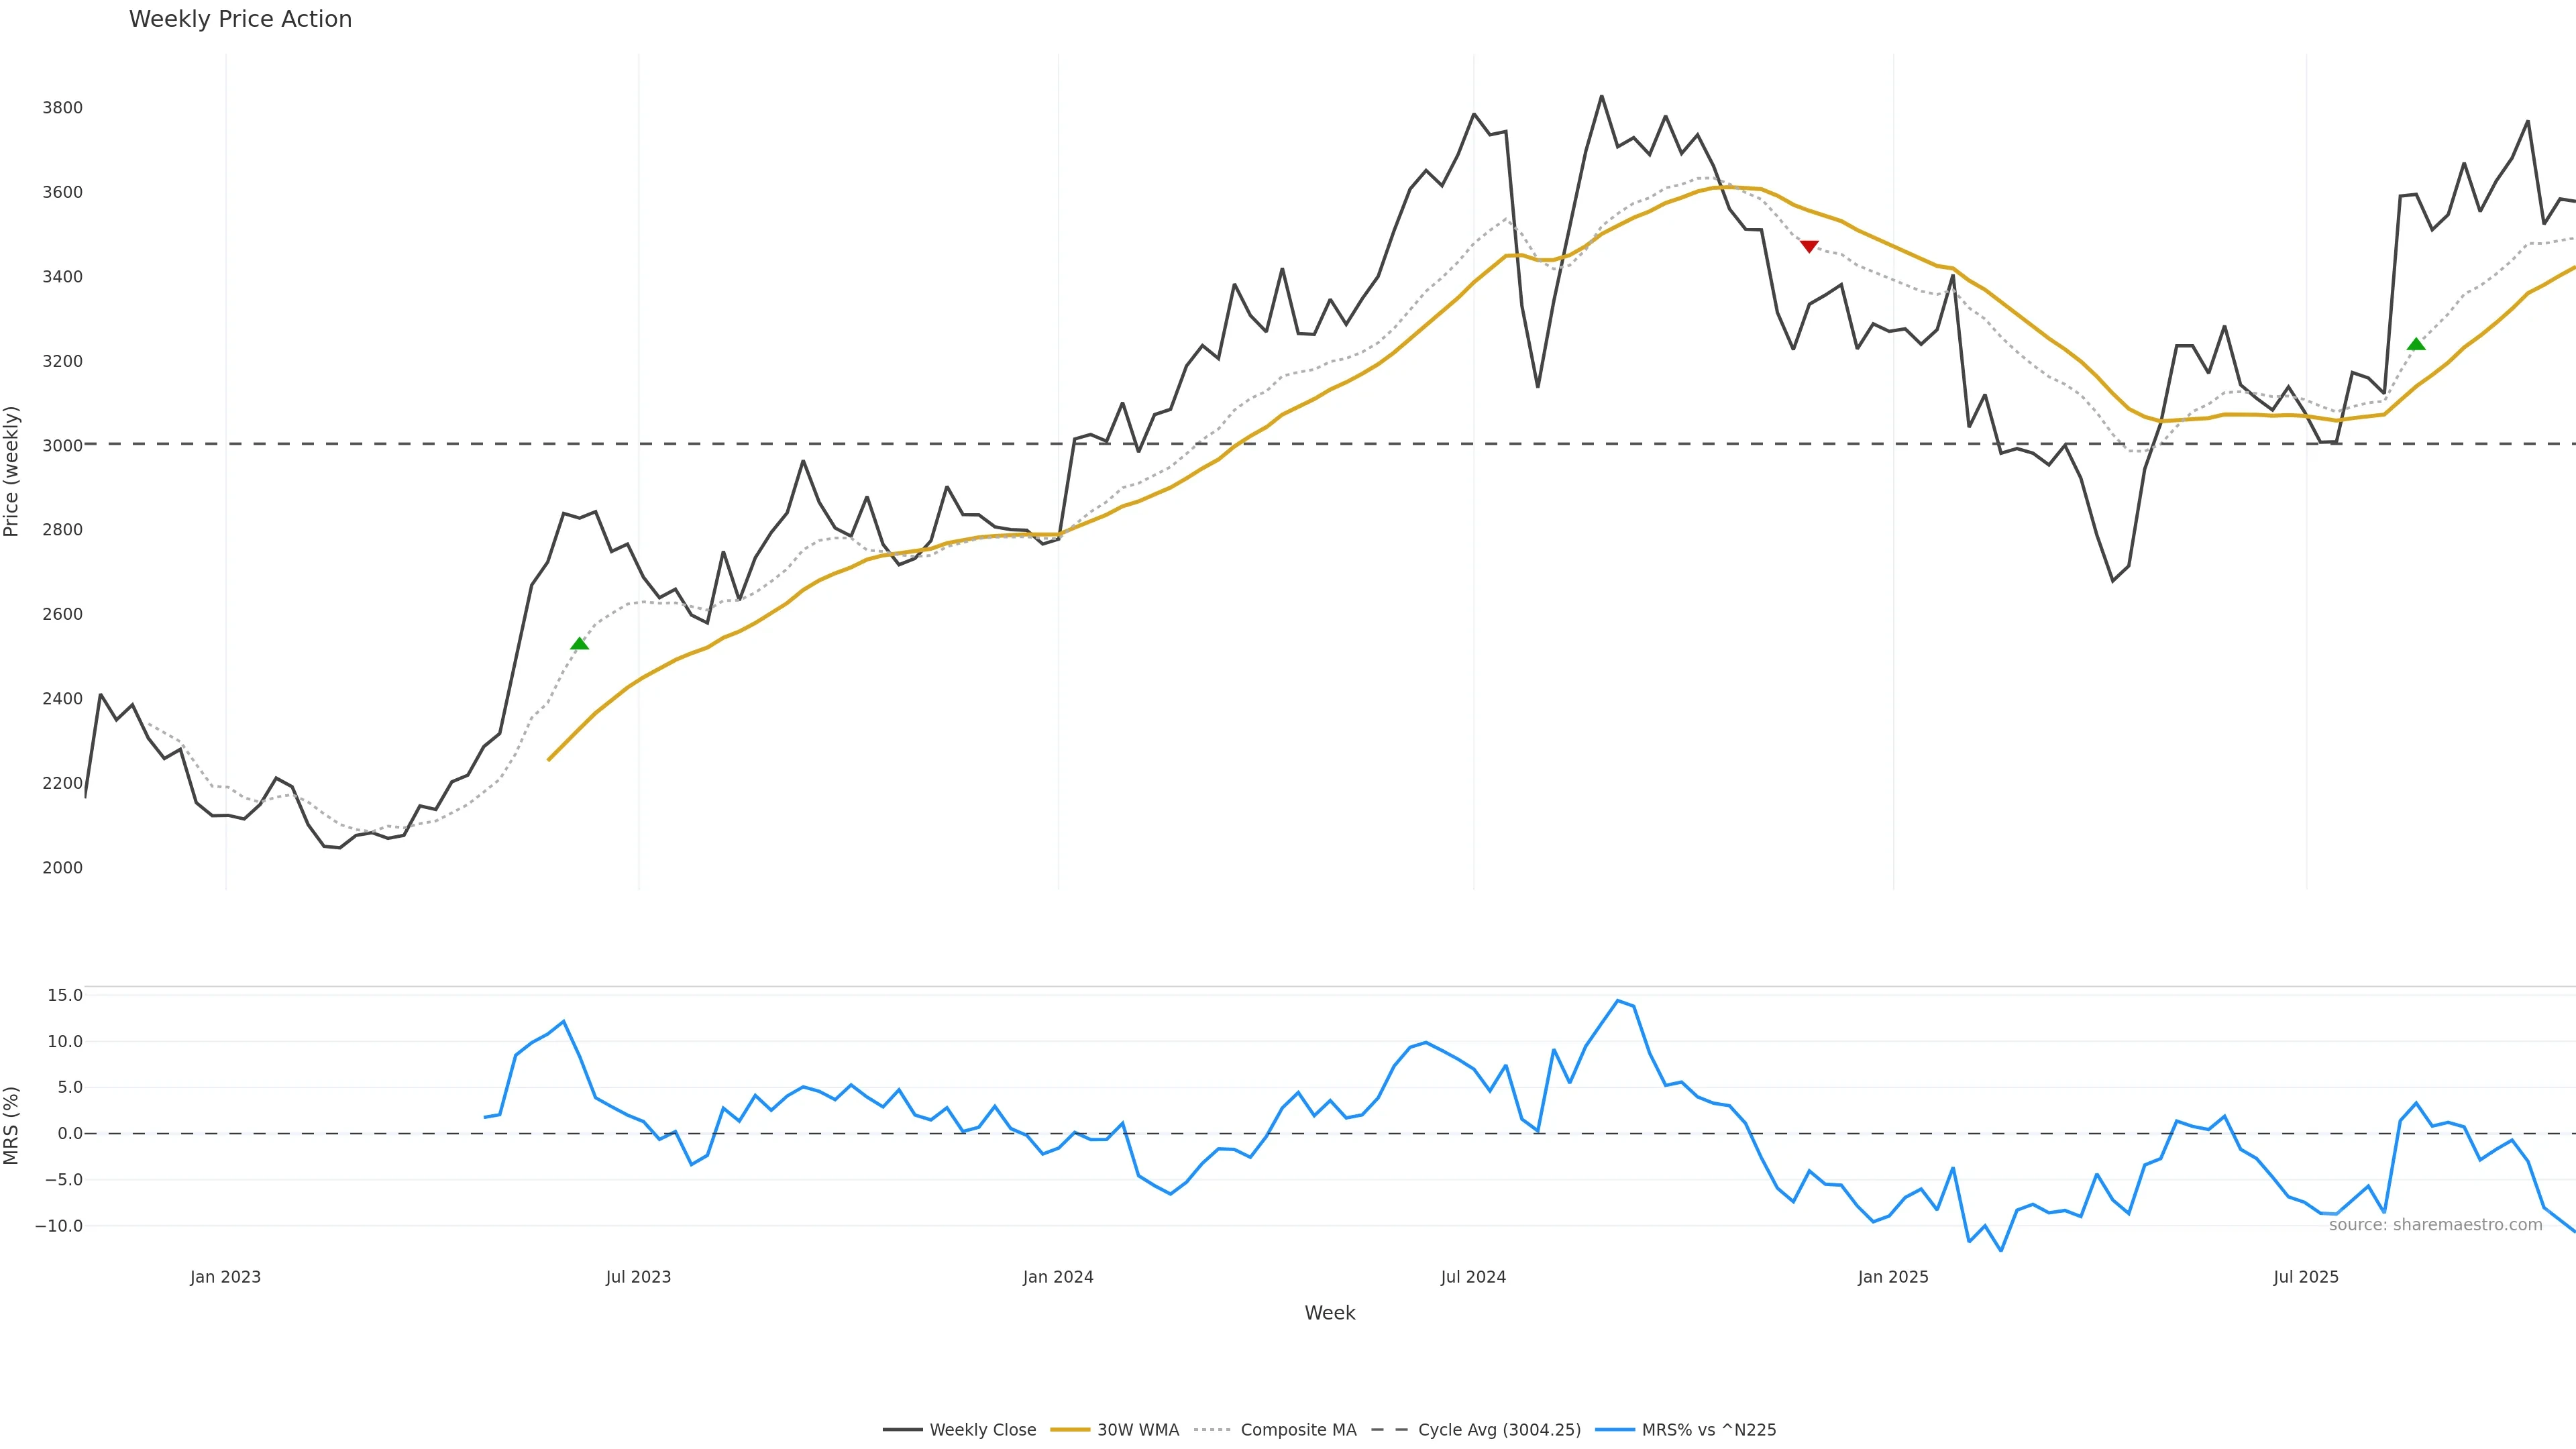
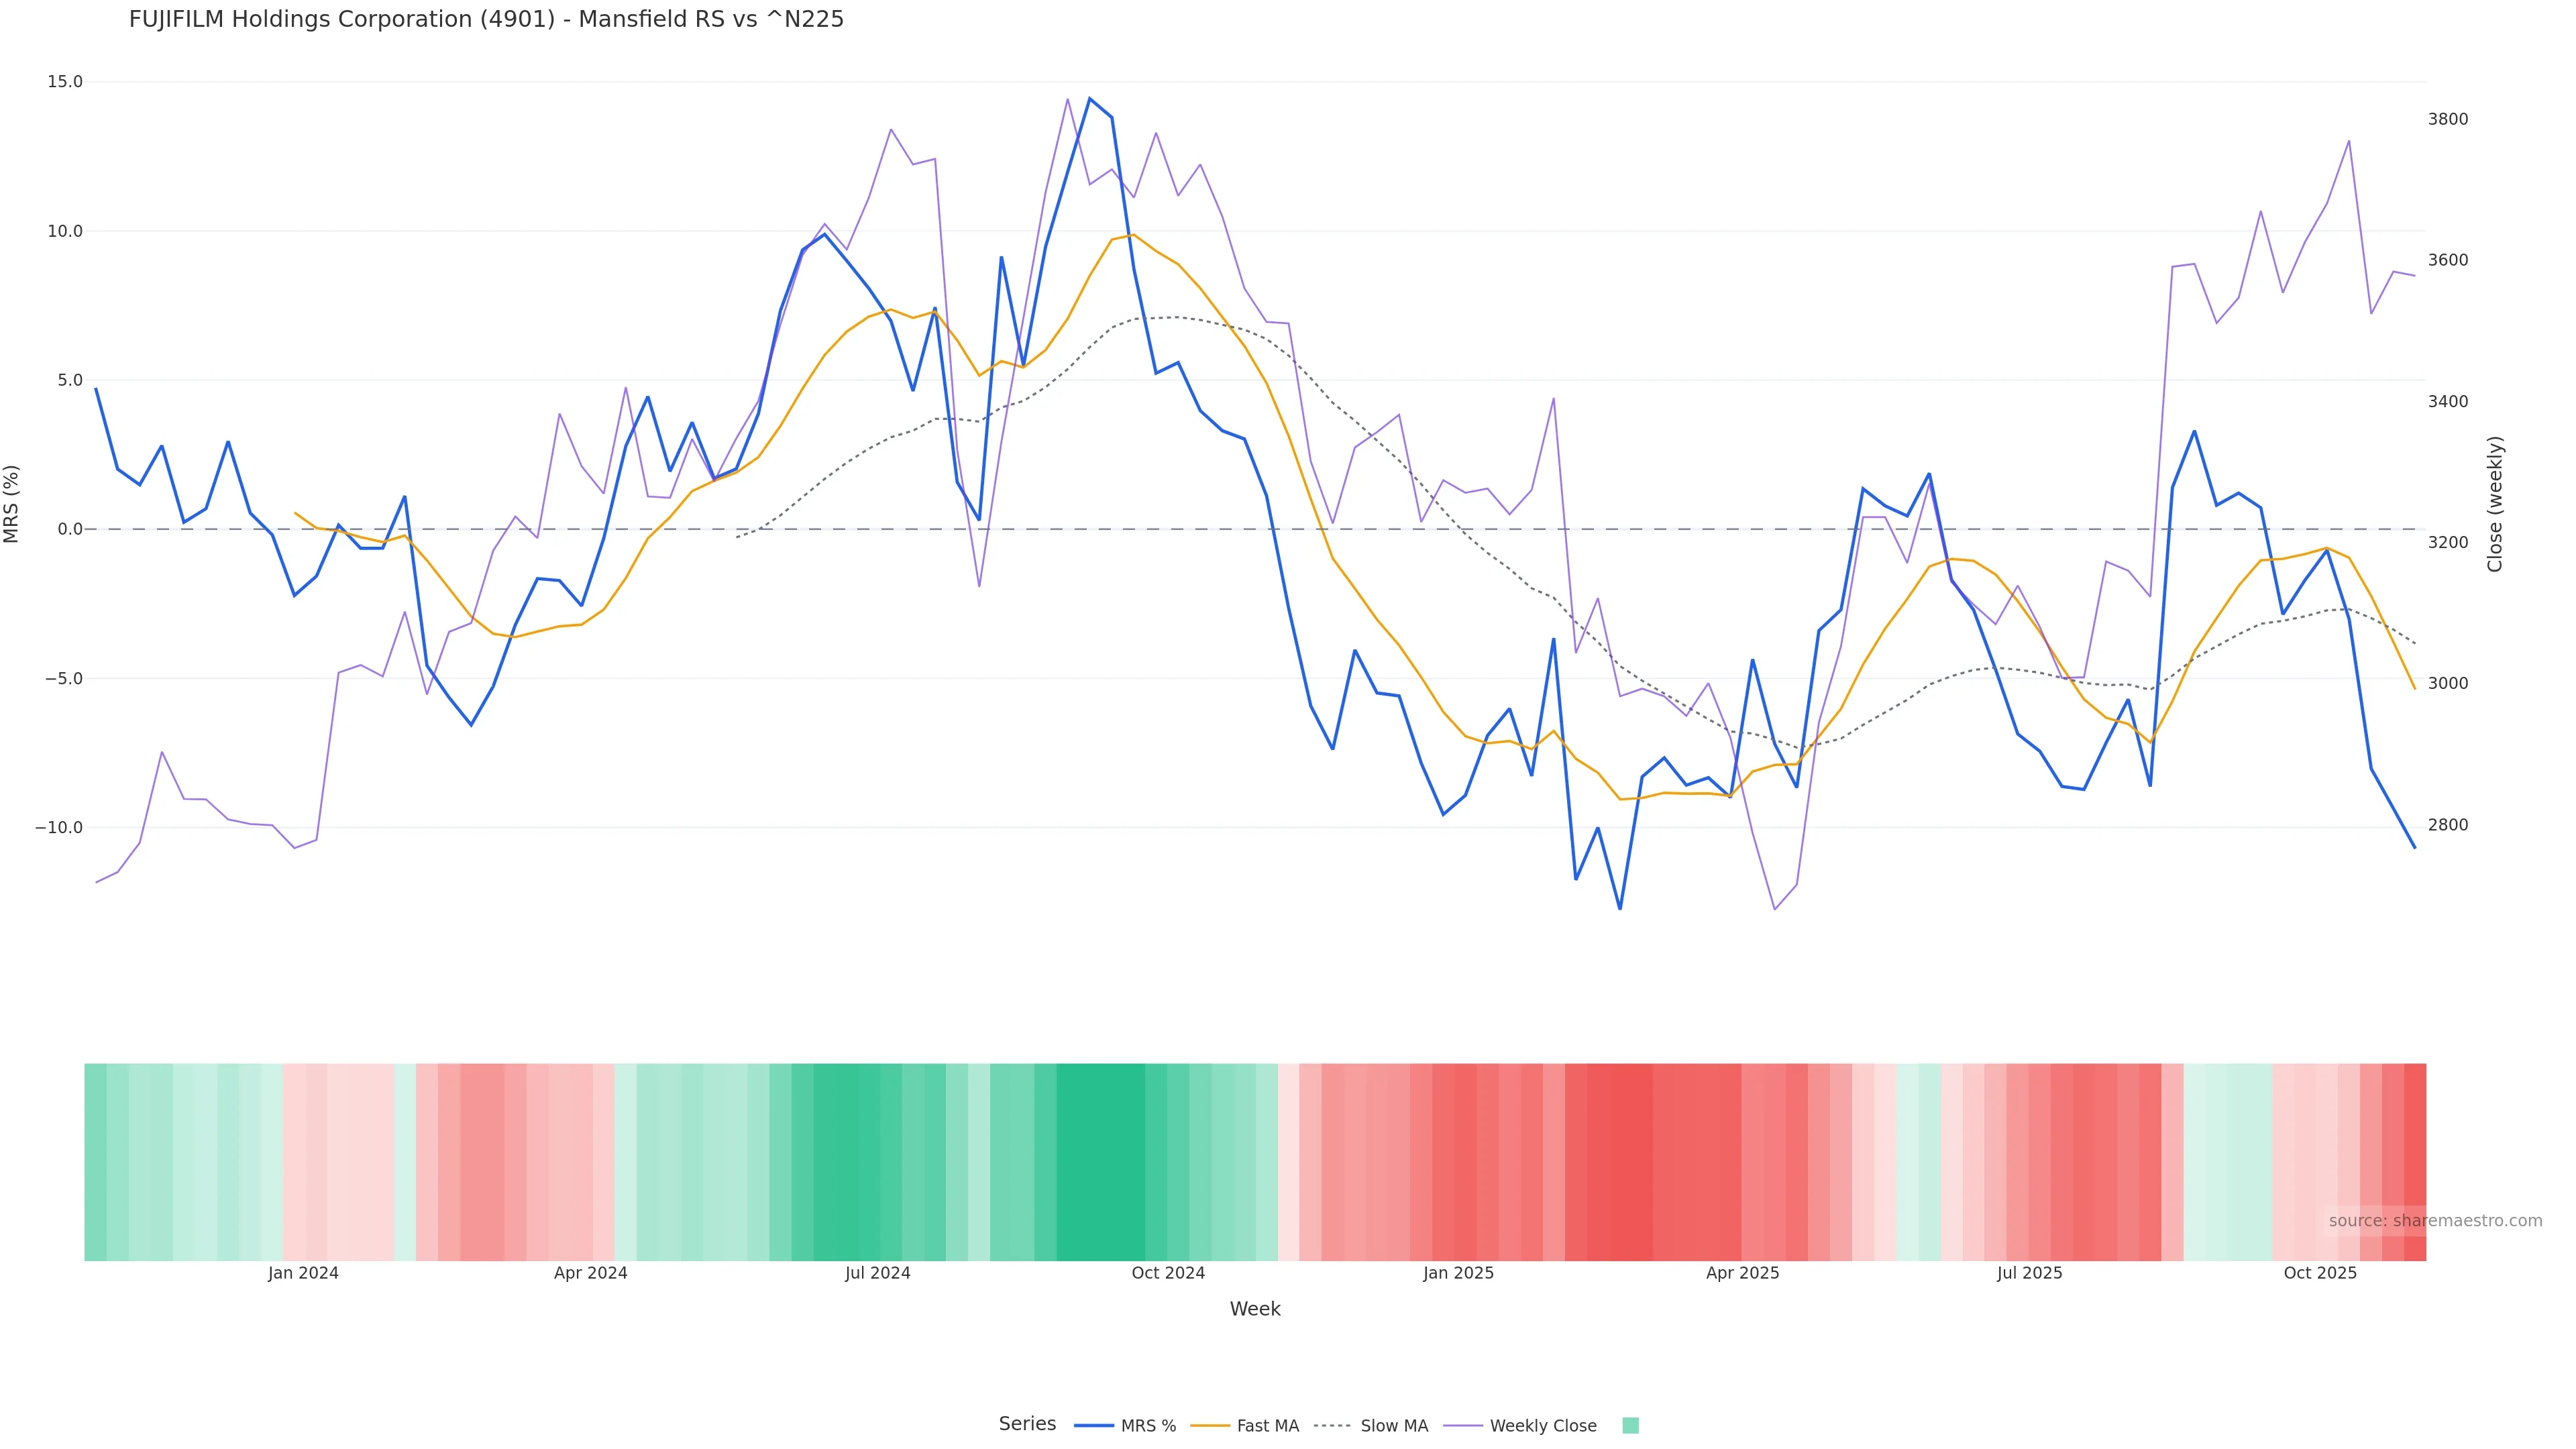
Mansfield Relative Strength
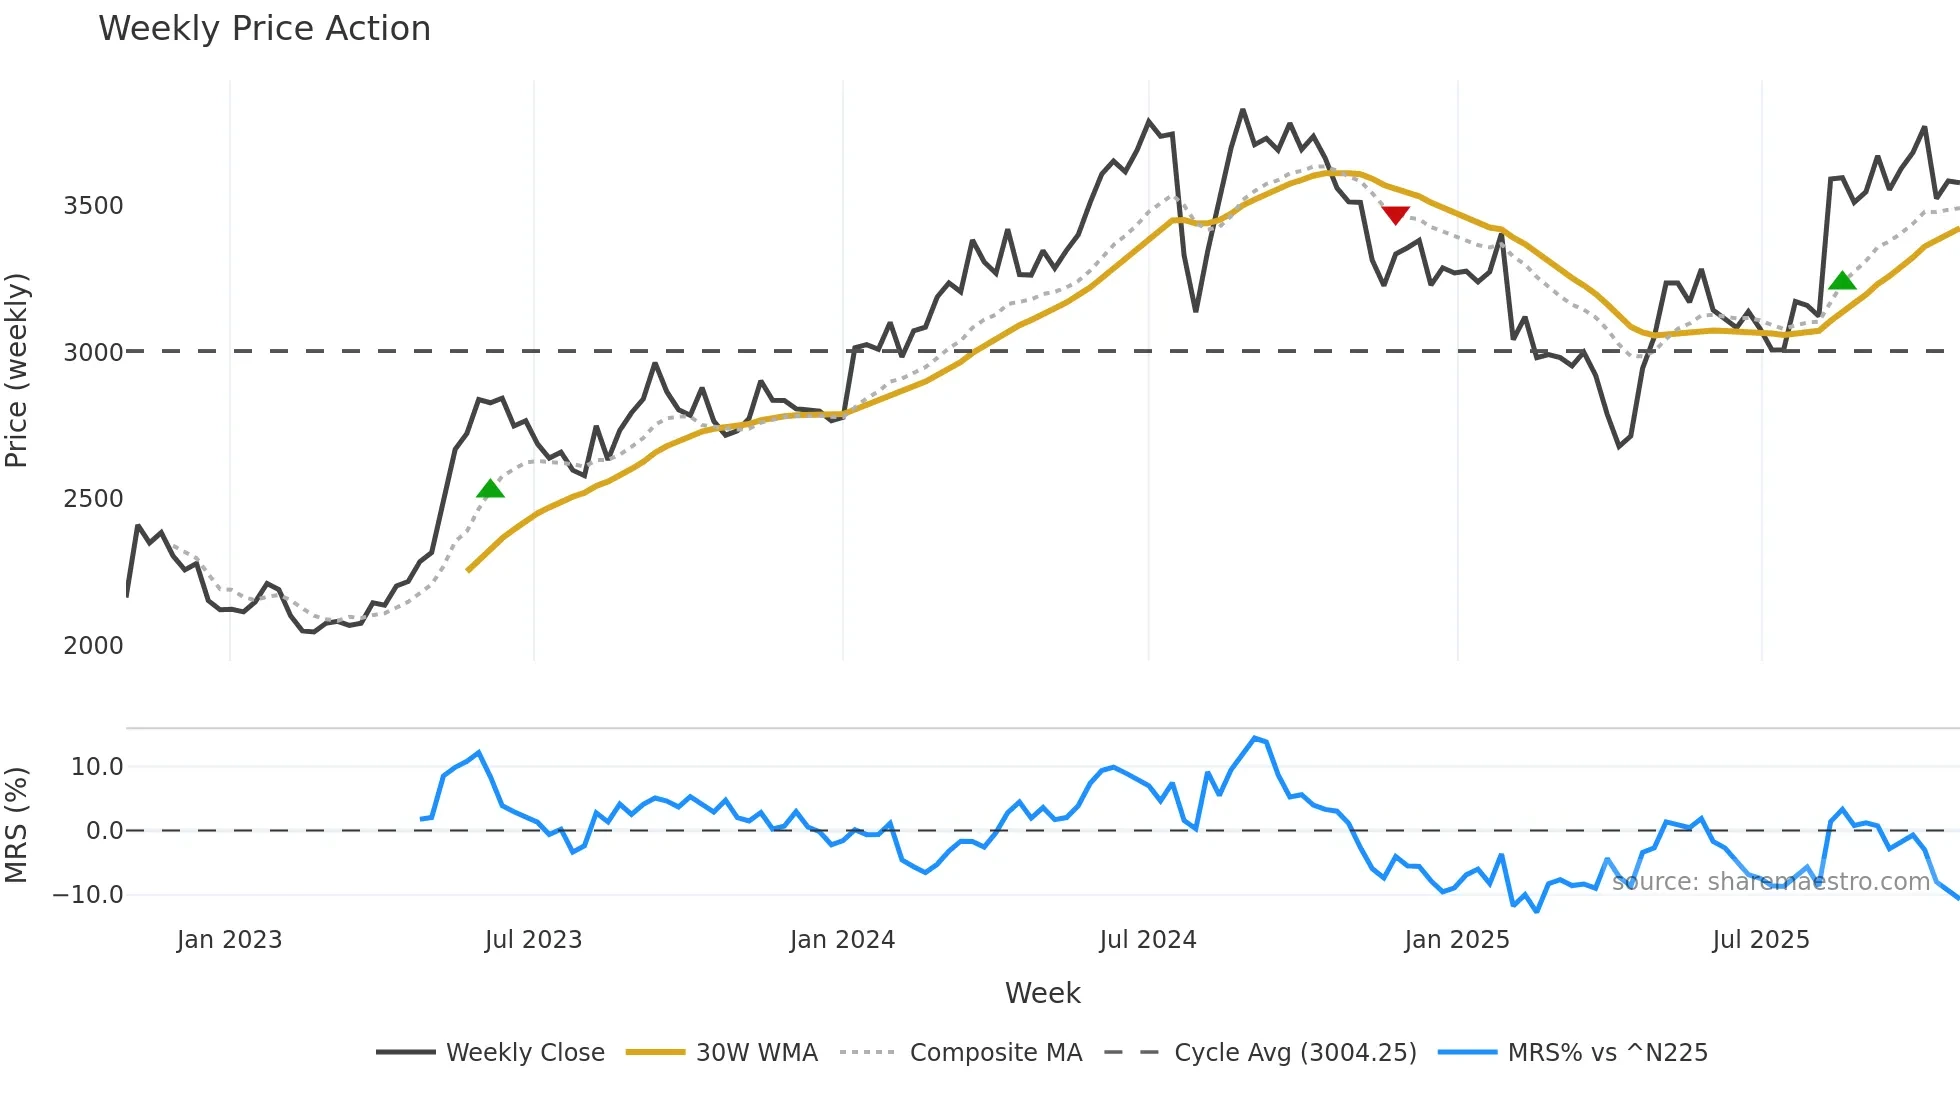
Mansfield RS vs ^N225 is negative and weakening. — Avoid unless a reversal forms.
Score -0.5
+0 / -1
Mansfield RS vs ^N225 is negative and weakening.
Mansfield RS vs ^N225 is negative and weakening. Avoid unless a reversal forms. In essence this reflects Mansfield relative strength trend with a bearish tilt.
pol -0.5
conf 0.6
moderate · medium
What it means
Mansfield RS vs ^N225 is negative and weakening. Avoid unless a reversal forms. In essence this reflects Mansfield relative strength trend with a bearish tilt.
Implications
Raises risk of failed breakouts; strength must prove itself on closes. (pol -0.50, conf 0.60 → moderate/medium)
No additional observations.