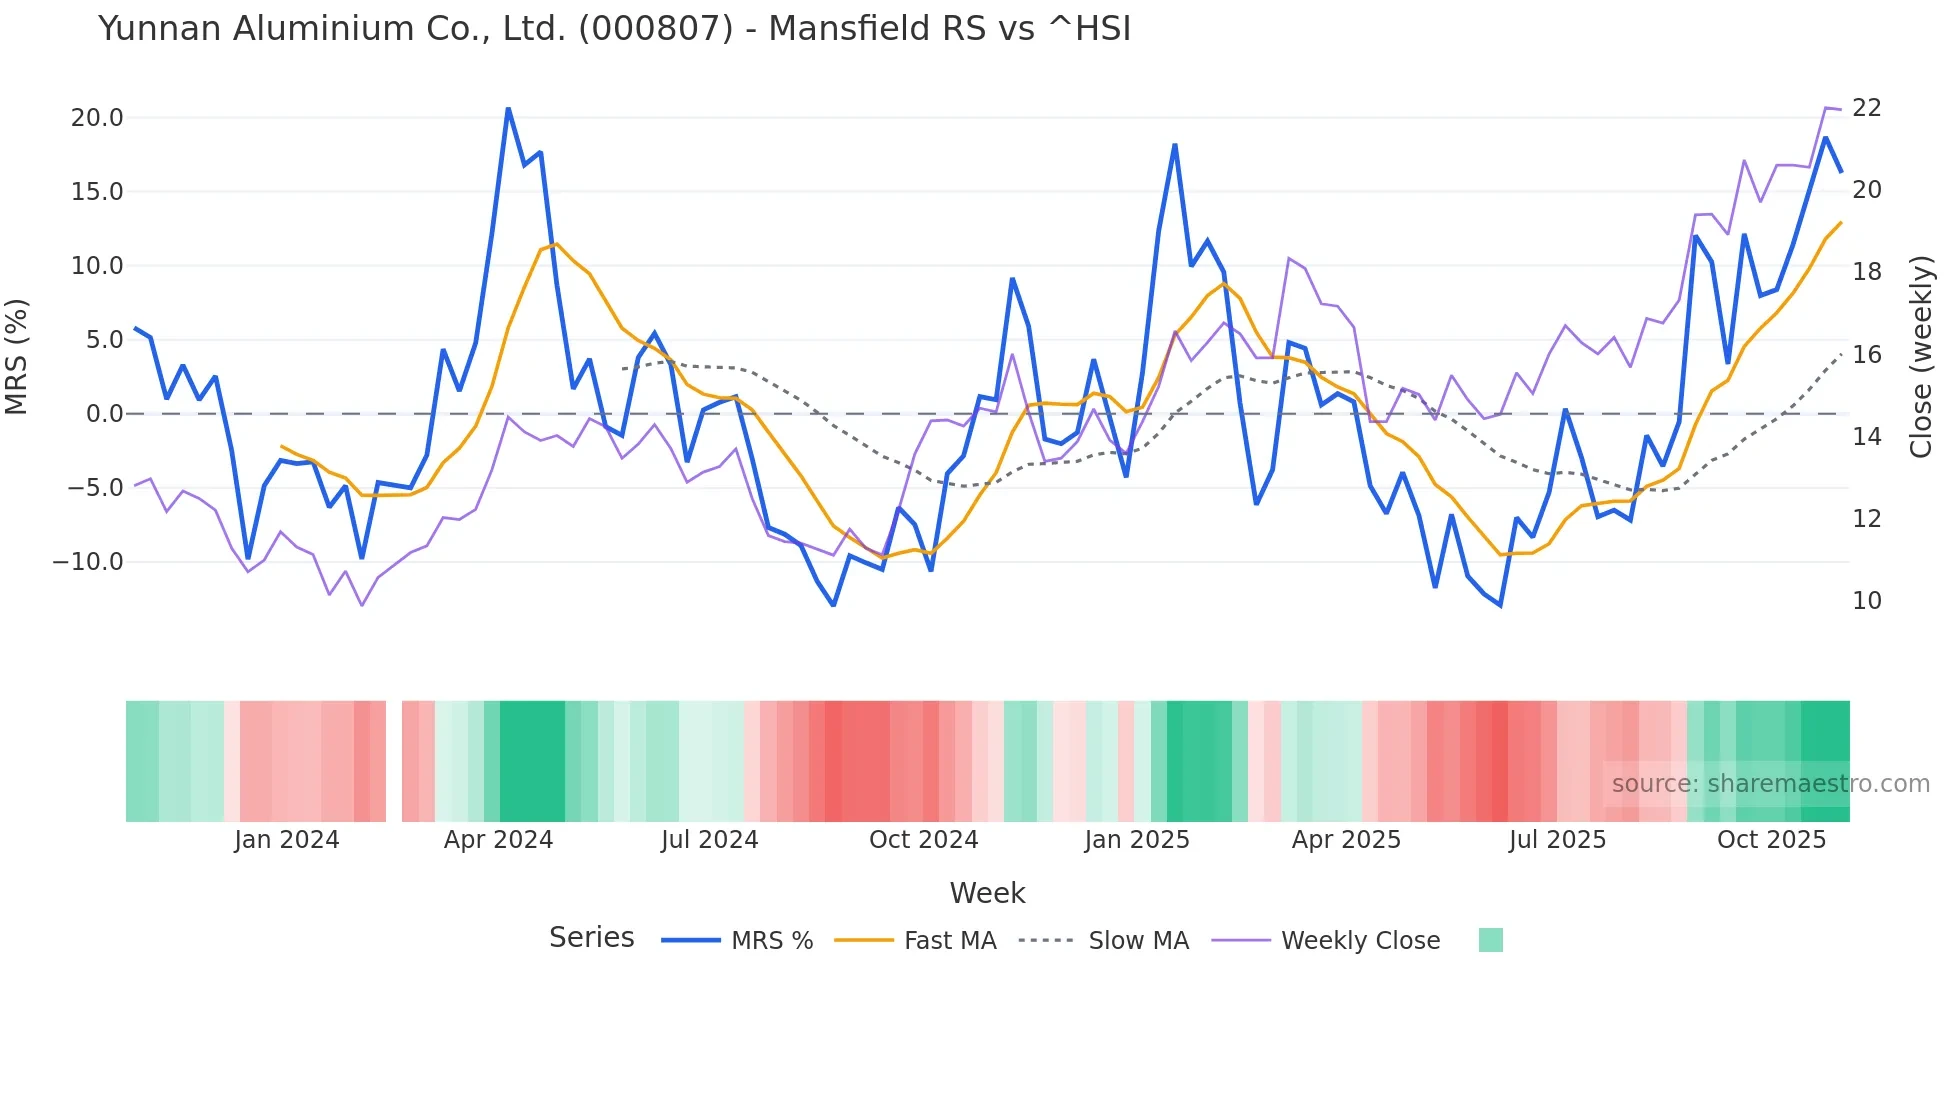
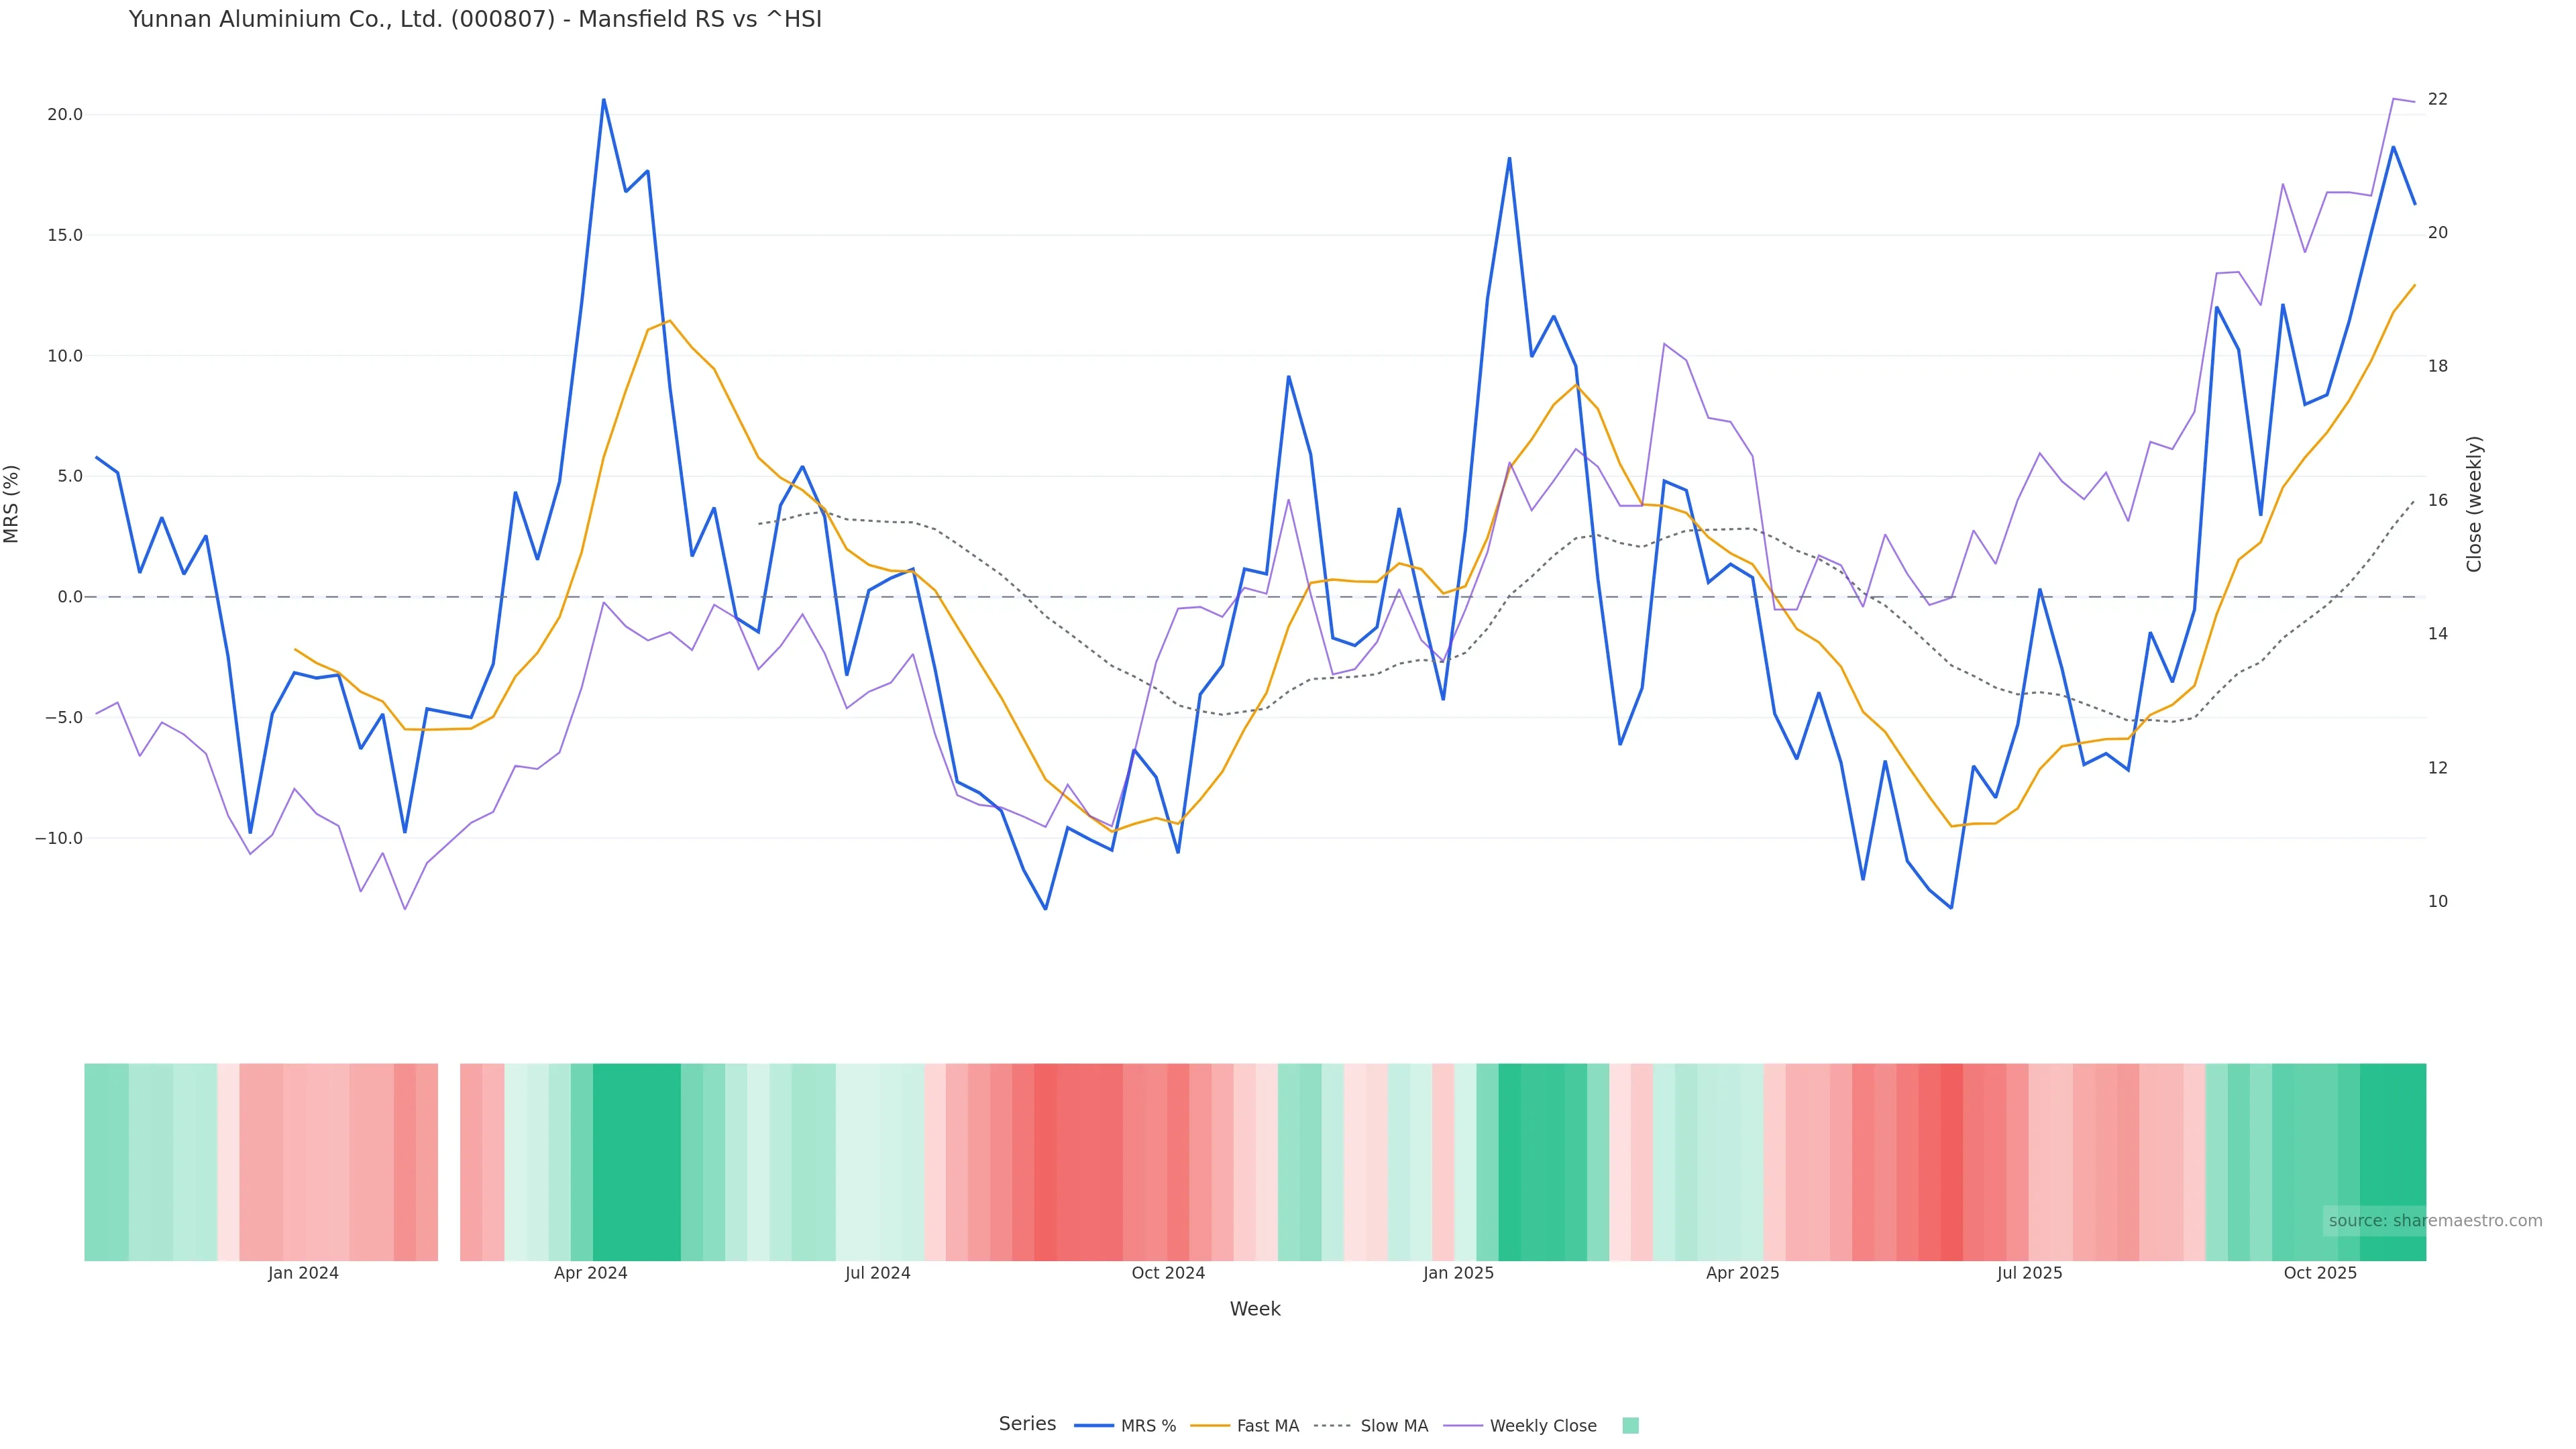
Mansfield Relative Strength
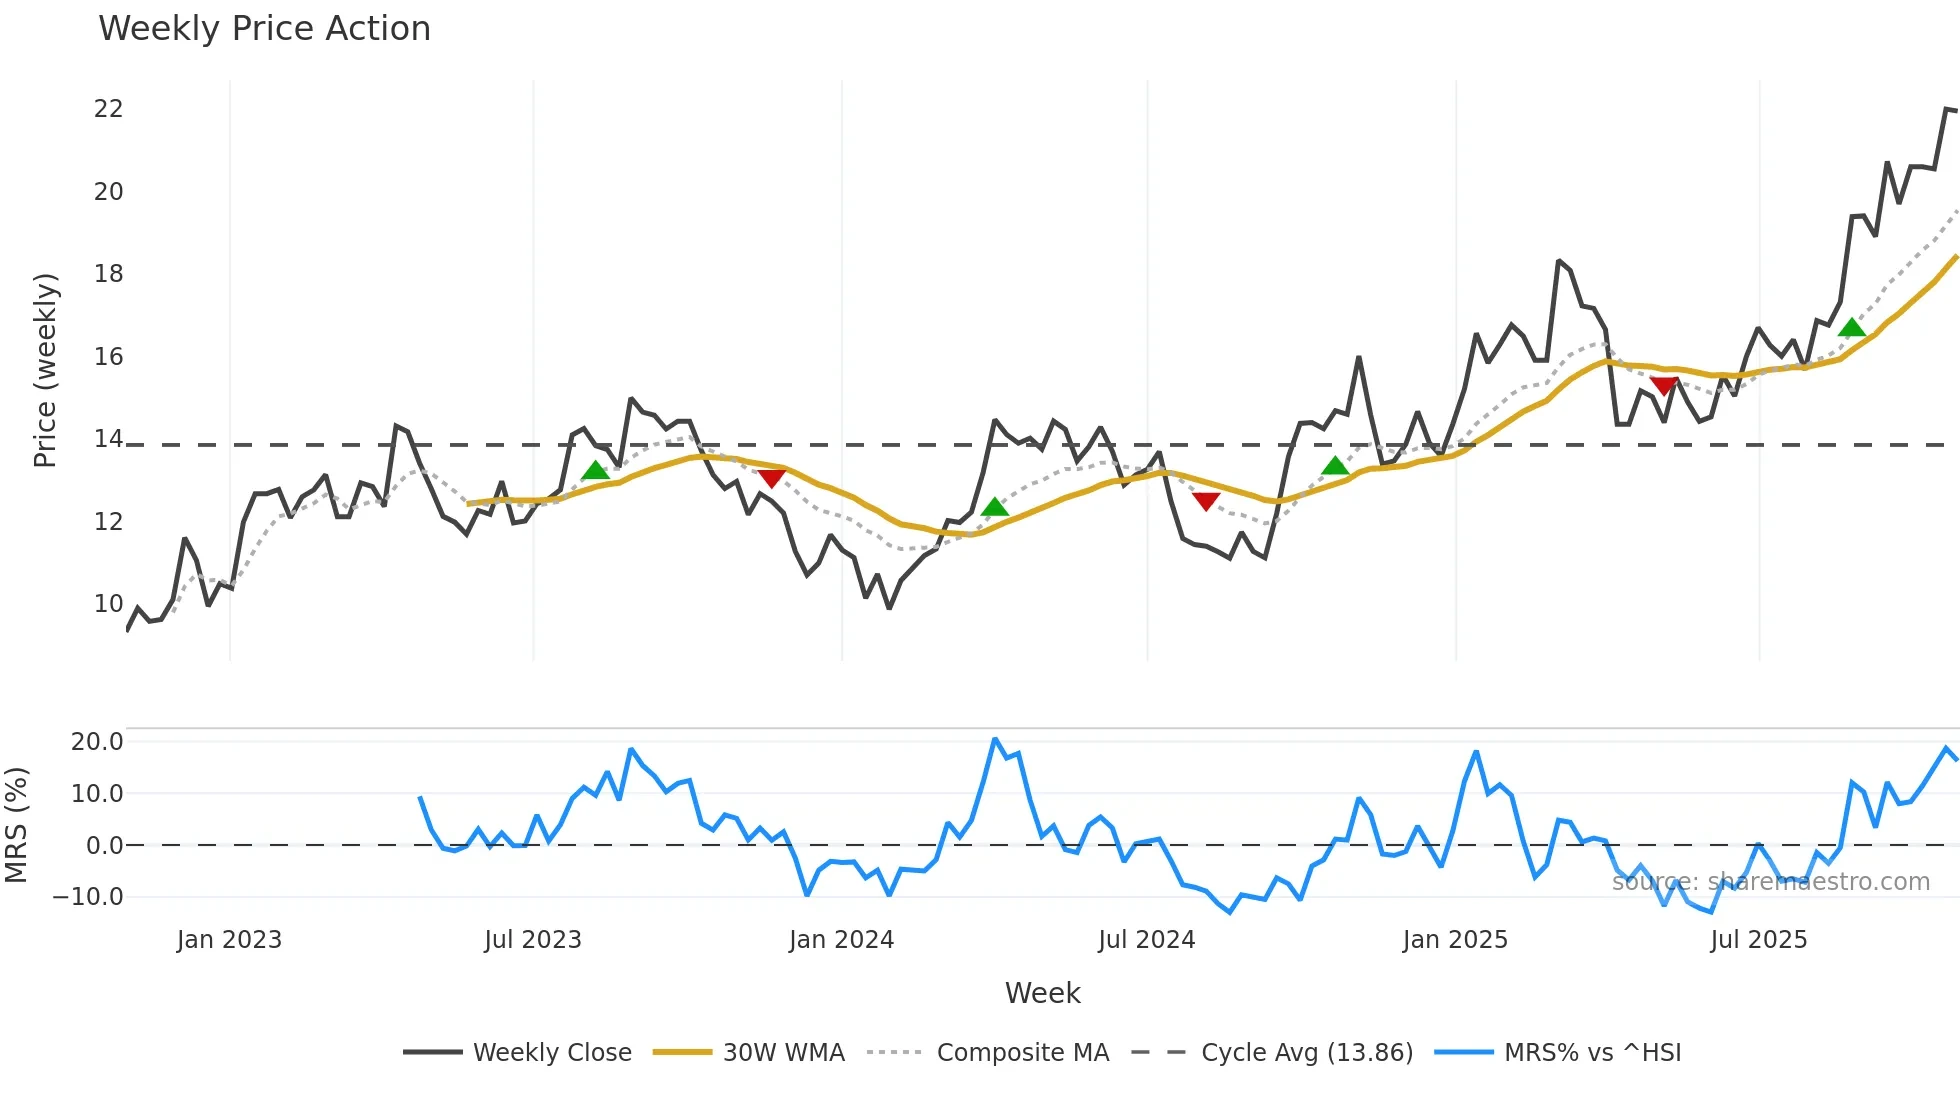
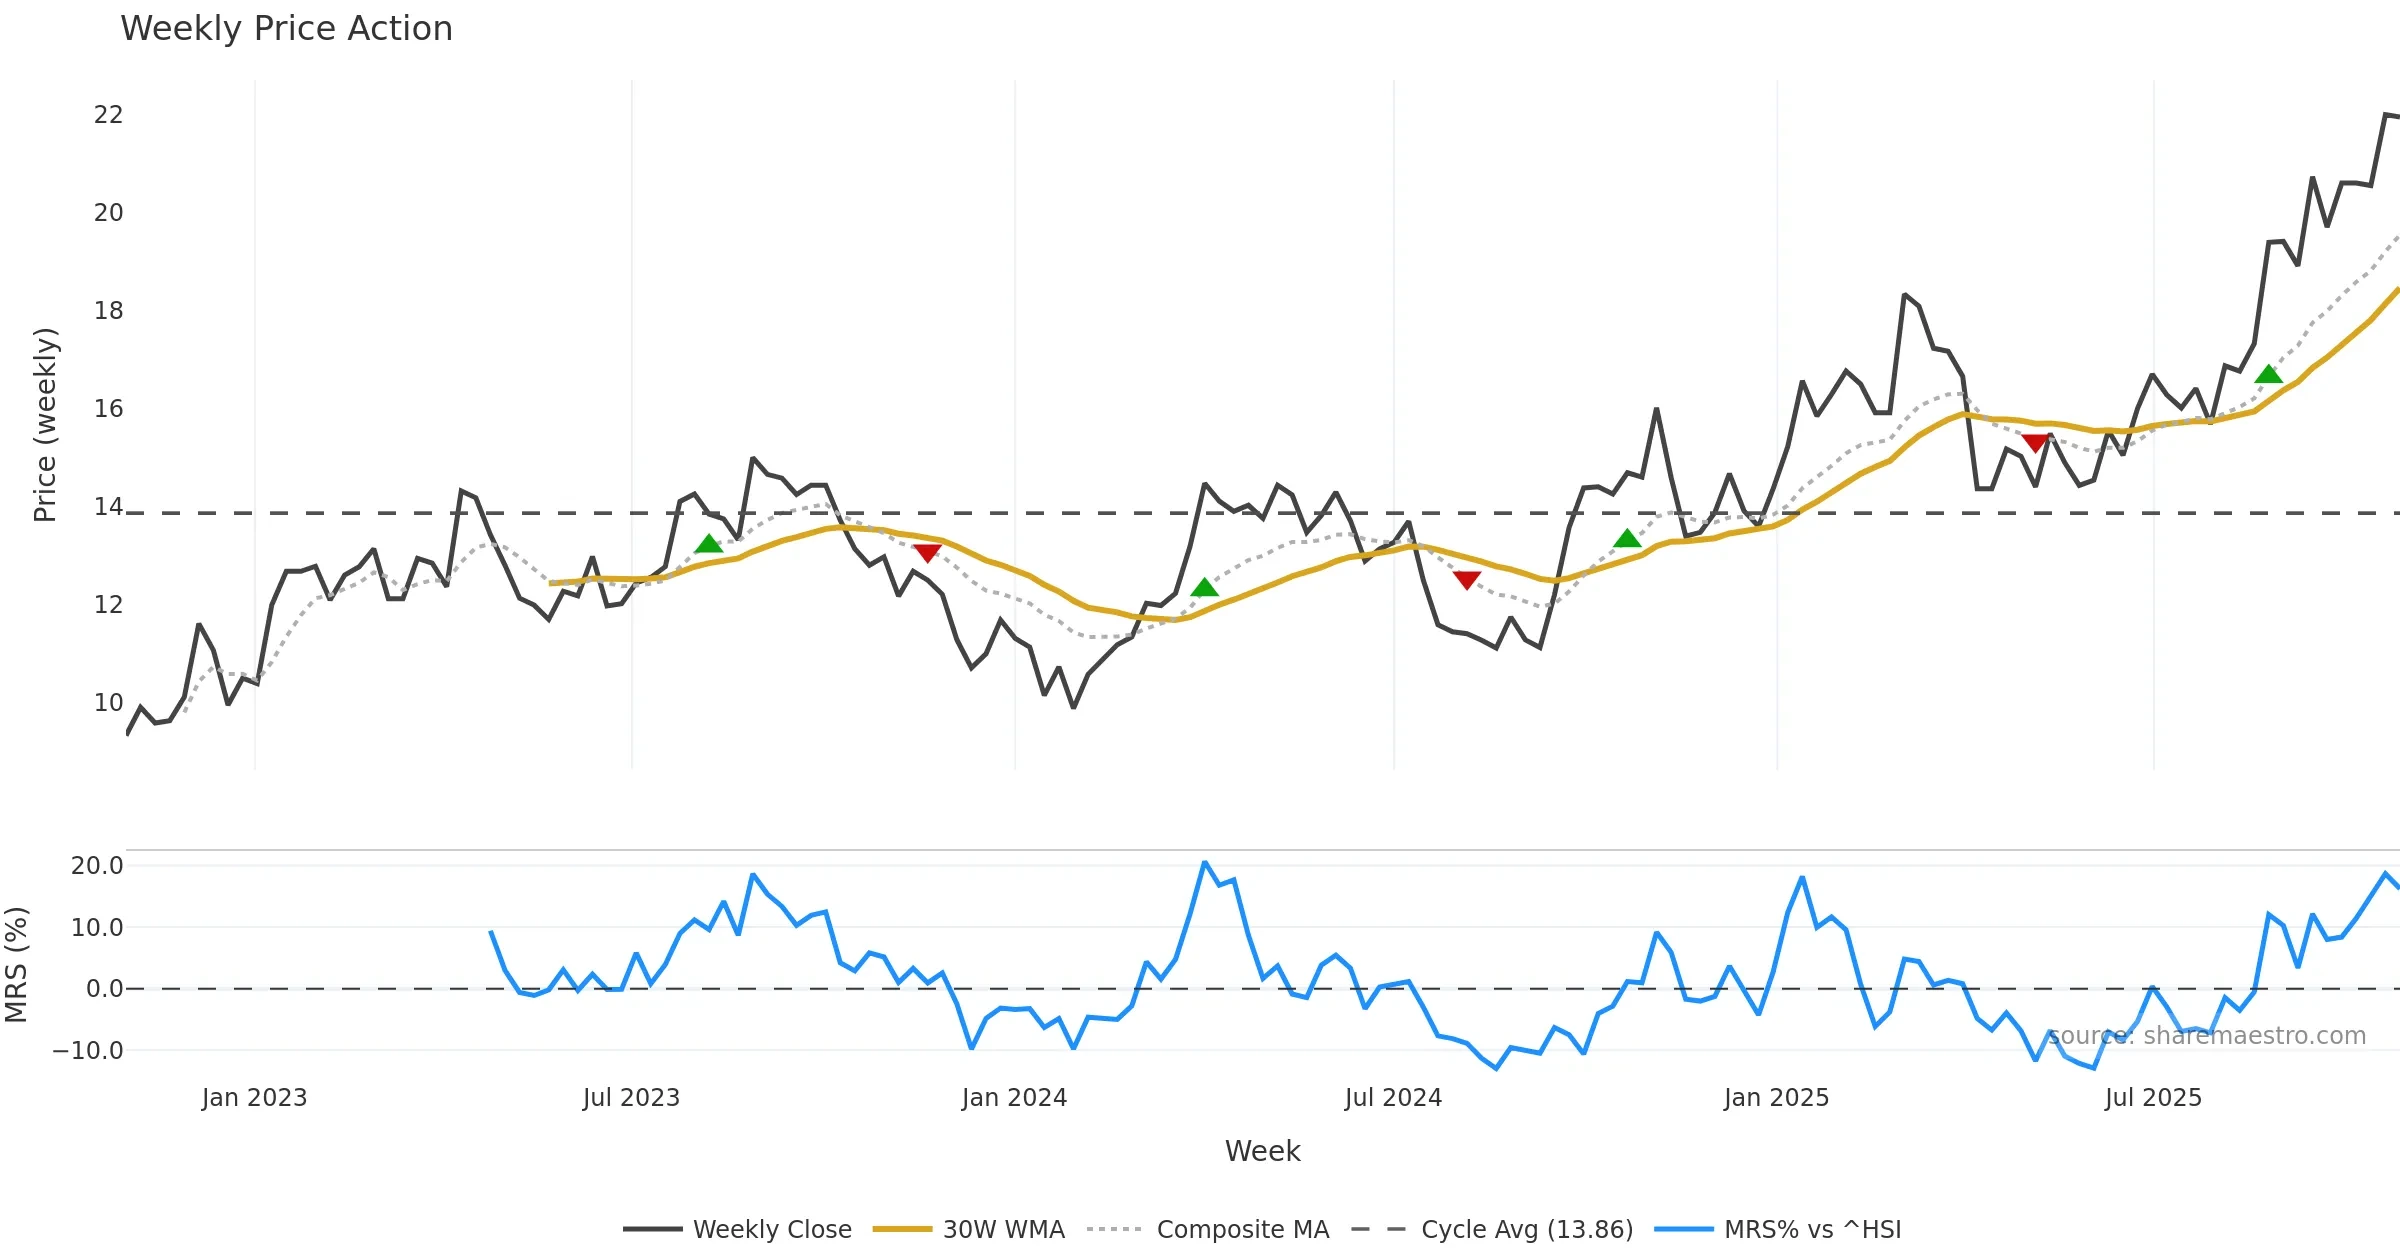
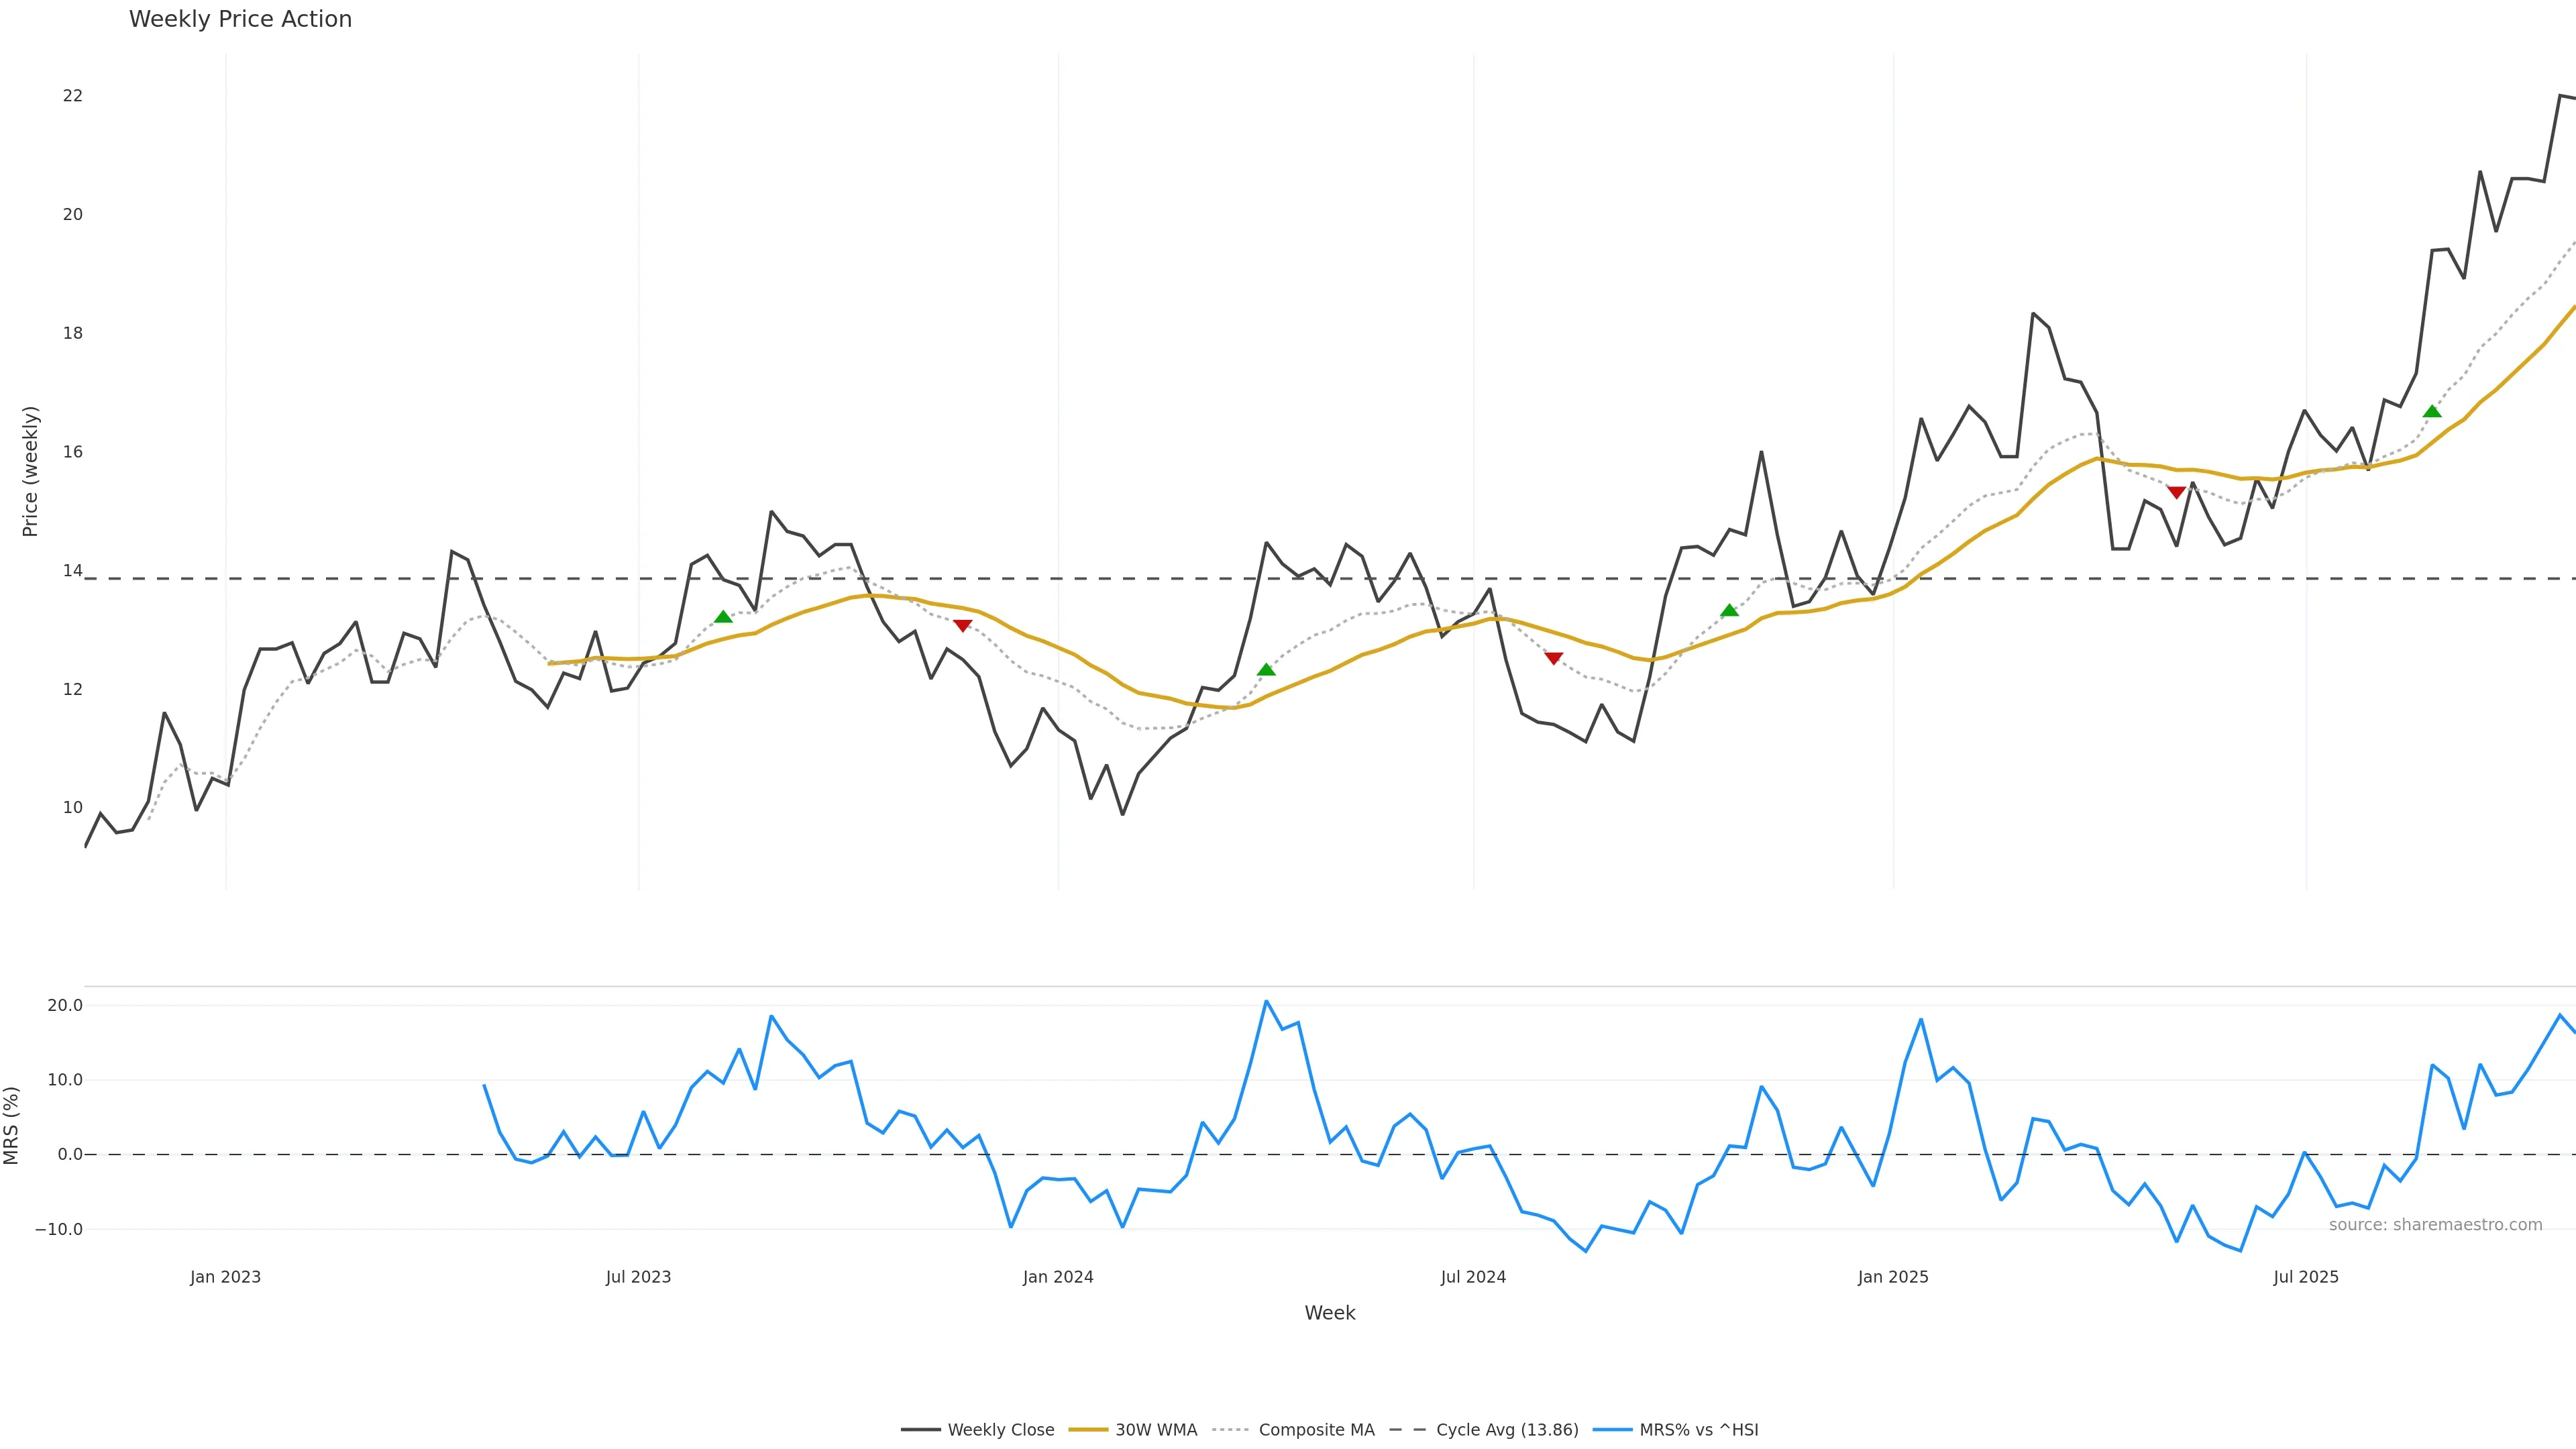
Mansfield RS vs ^HSI is positive and rising. — Outperformance tailwind for swing entries.
Score 0.55
+1 / -0
Mansfield RS vs ^HSI is positive and rising.
Mansfield RS vs ^HSI is positive and rising. Outperformance tailwind for swing entries. In essence this reflects Mansfield relative strength trend with a bullish tilt.
pol 0.55
conf 0.6
moderate · medium
What it means
Mansfield RS vs ^HSI is positive and rising. Outperformance tailwind for swing entries. In essence this reflects Mansfield relative strength trend with a bullish tilt.
Implications
Improves odds for follow-through if pullbacks hold higher lows. (pol 0.55, conf 0.60 → moderate/medium)
No additional observations.