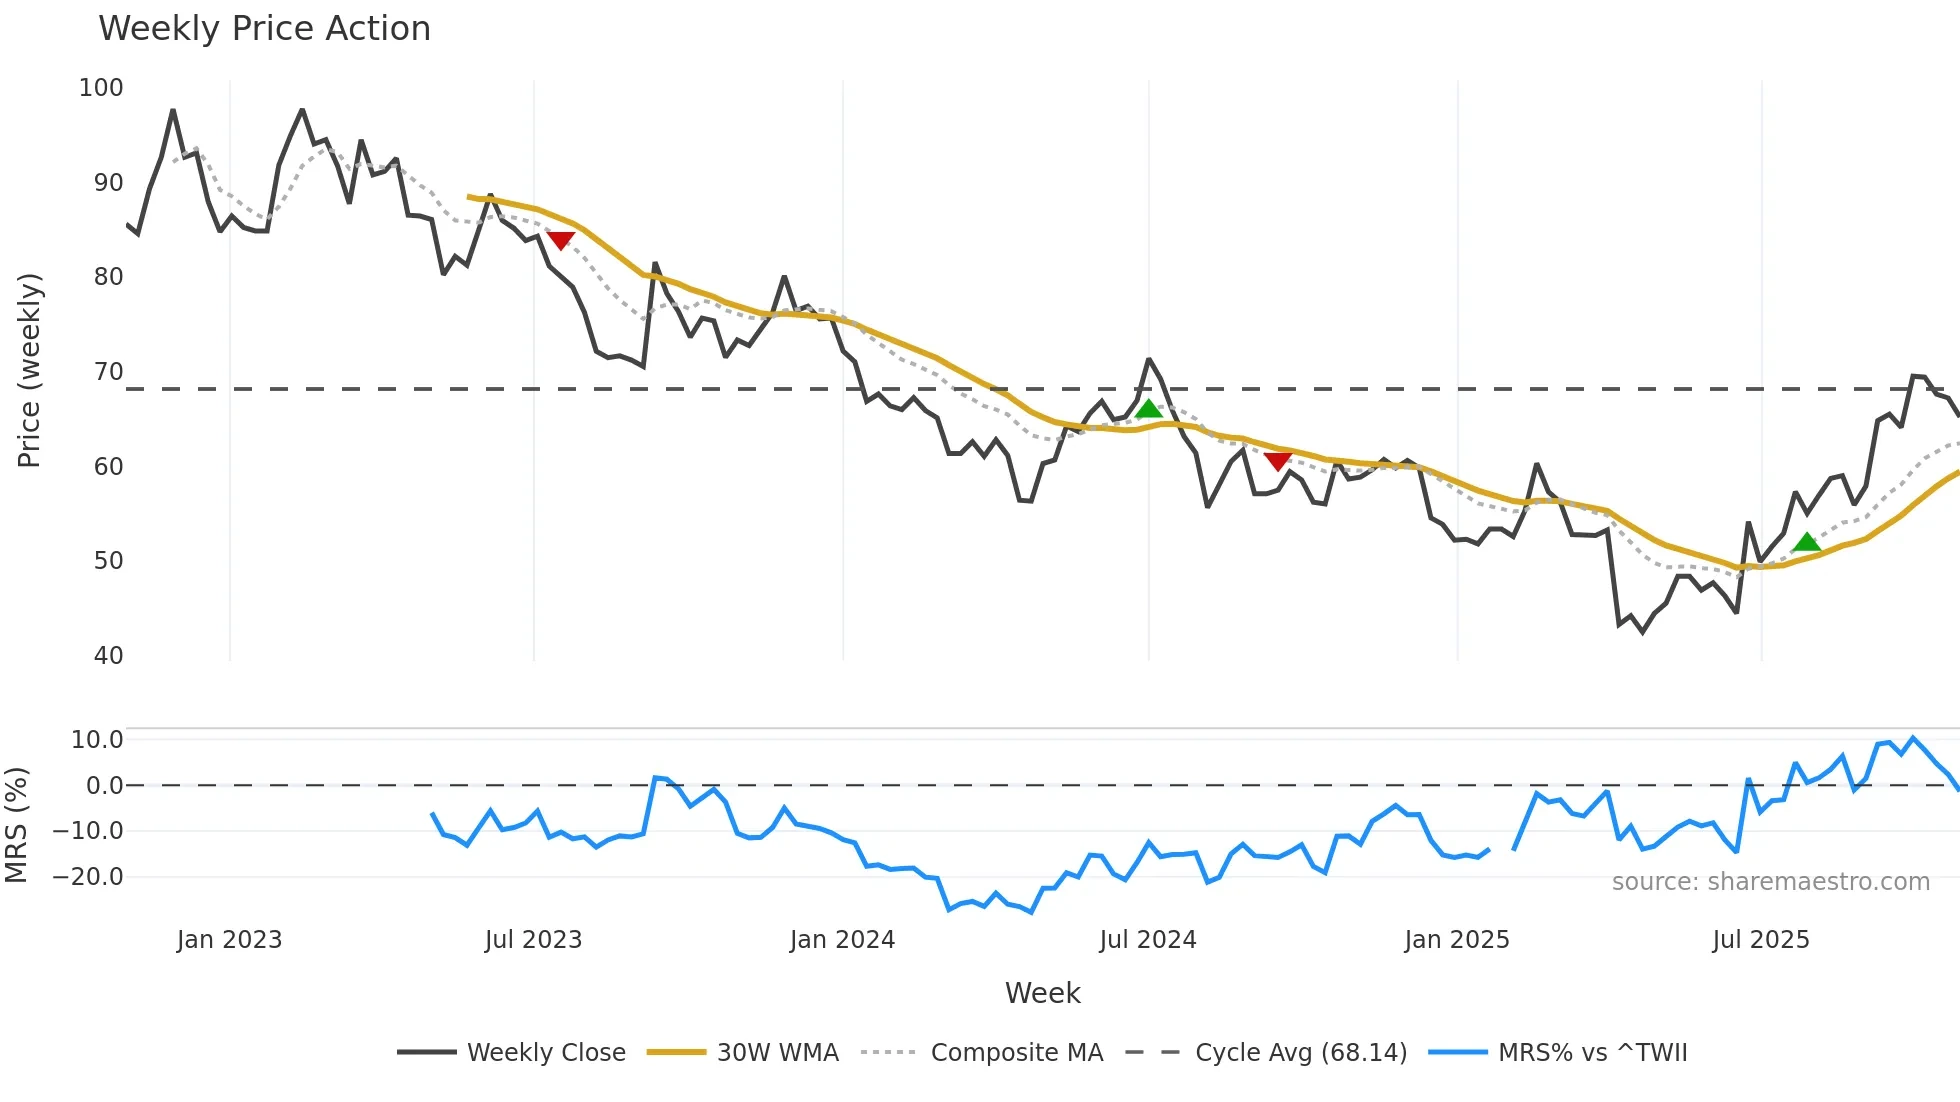
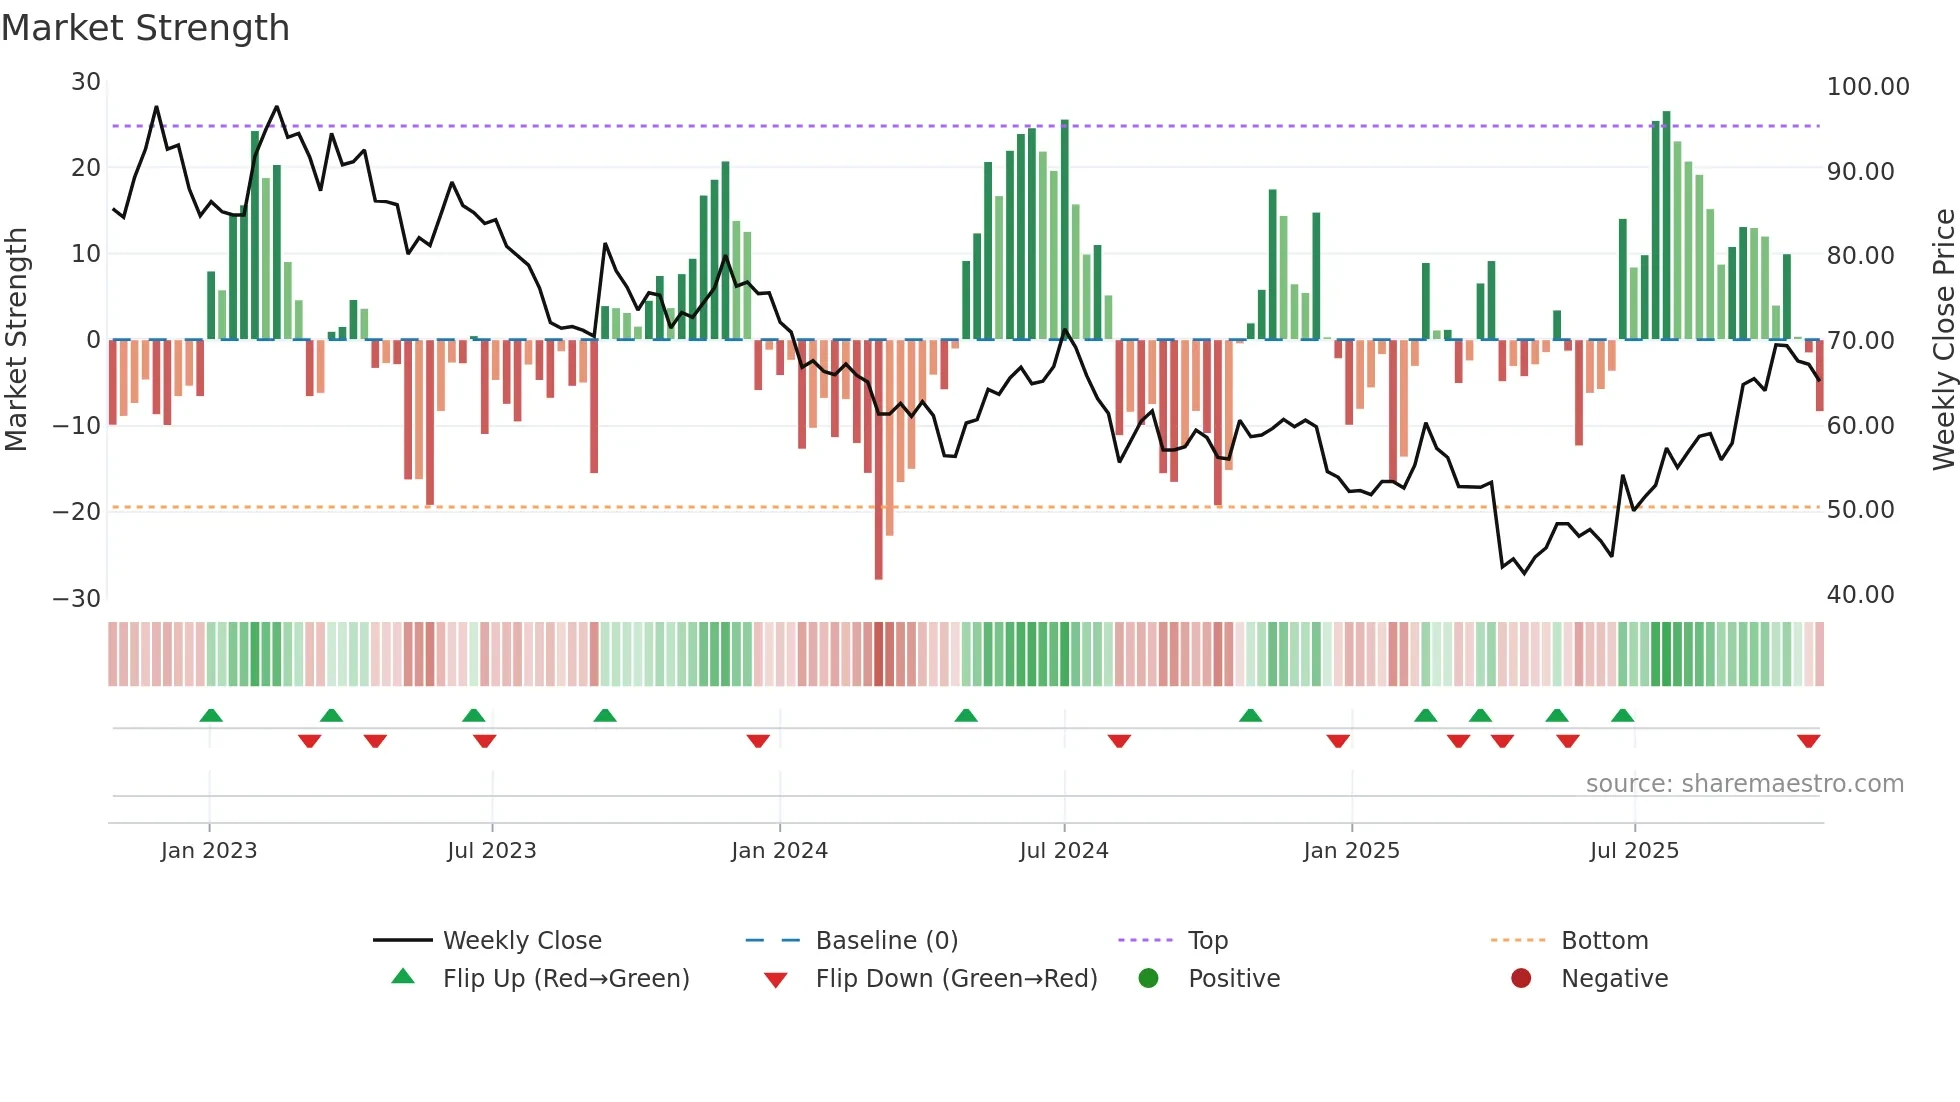
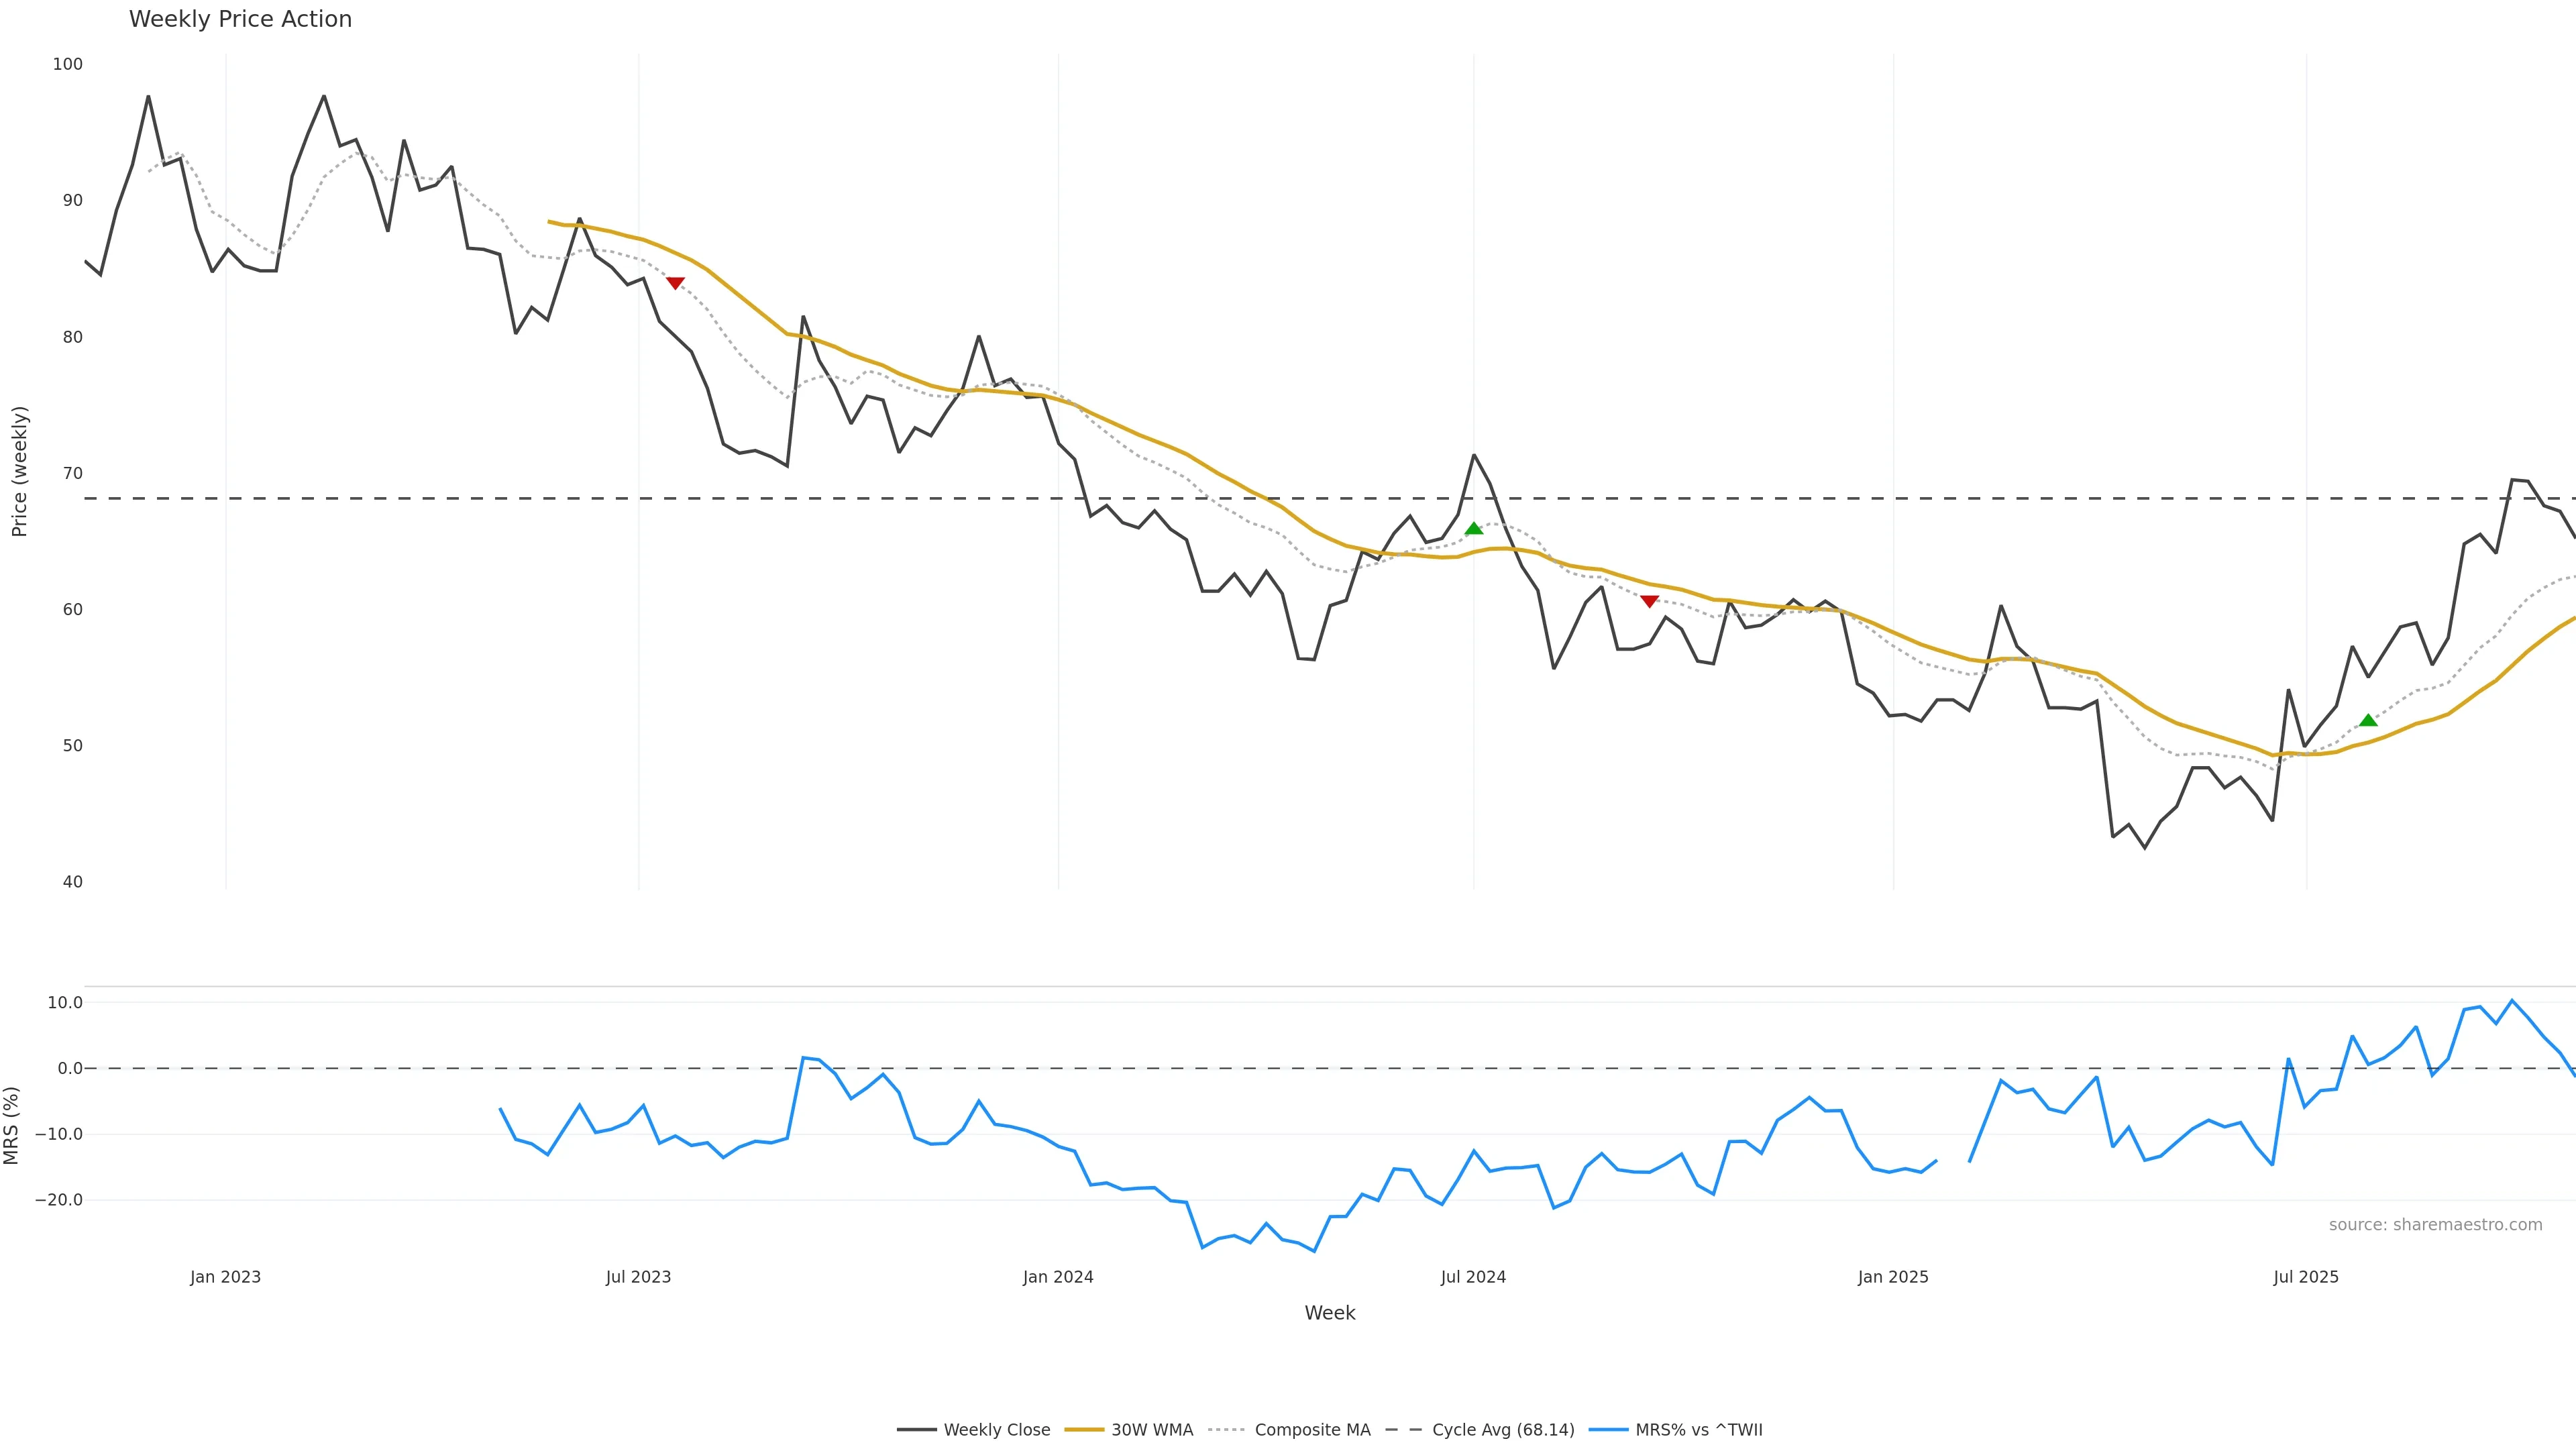
Market Cycle (Mean Reversion Context)
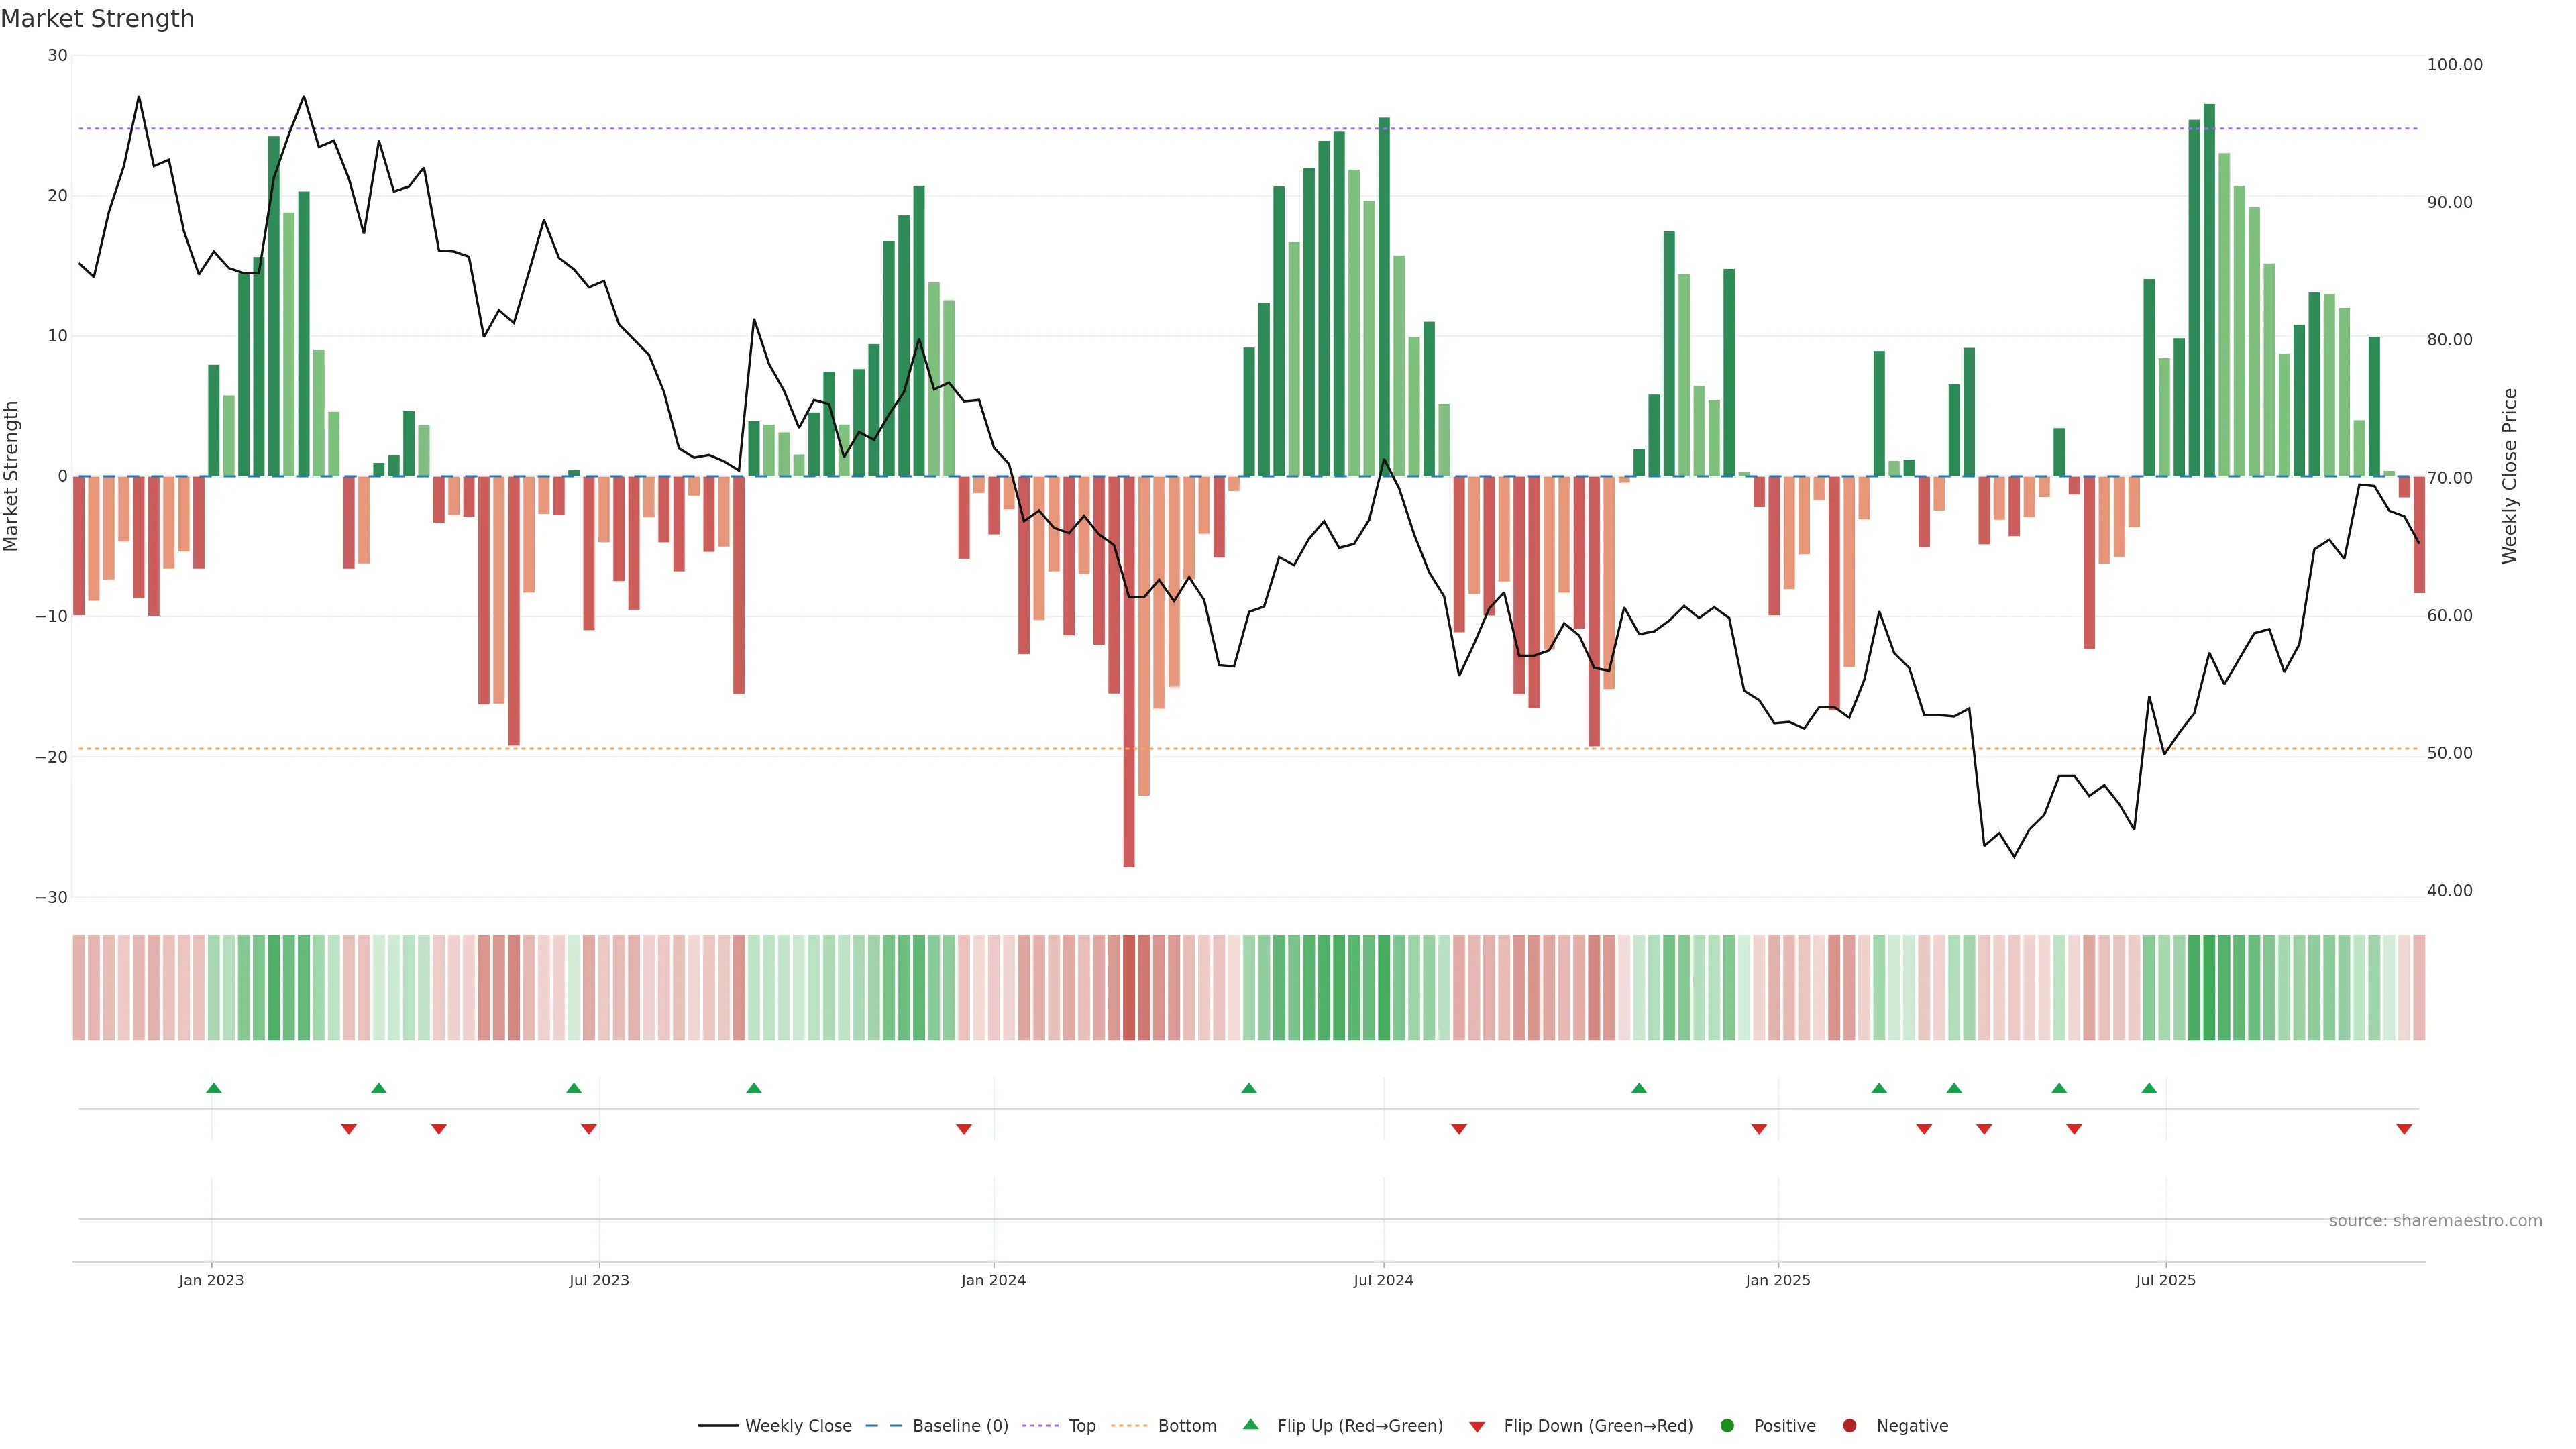
Cycle is below zero and turning up (early mean-reversion attempt). — Earliest entries come as slope flips up sub-zero.
Score 0.6
+1 / -0
Level -4.319
Cycle is below zero and turning up (early mean-reversion attempt).
Cycle is below zero and turning up (early mean-reversion attempt). Earliest entries come as slope flips up sub-zero. In essence this reflects mean-reversion posture and cycle slope with a bullish tilt.
pol 0.6
conf 0.6
strong · medium
What it means
Cycle is below zero and turning up (early mean-reversion attempt). Earliest entries come as slope flips up sub-zero. In essence this reflects mean-reversion posture and cycle slope with a bullish tilt.
Implications
Improves odds for follow-through if pullbacks hold higher lows. Context: level -4.32. (pol 0.60, conf 0.60 → strong/medium)
No additional observations.