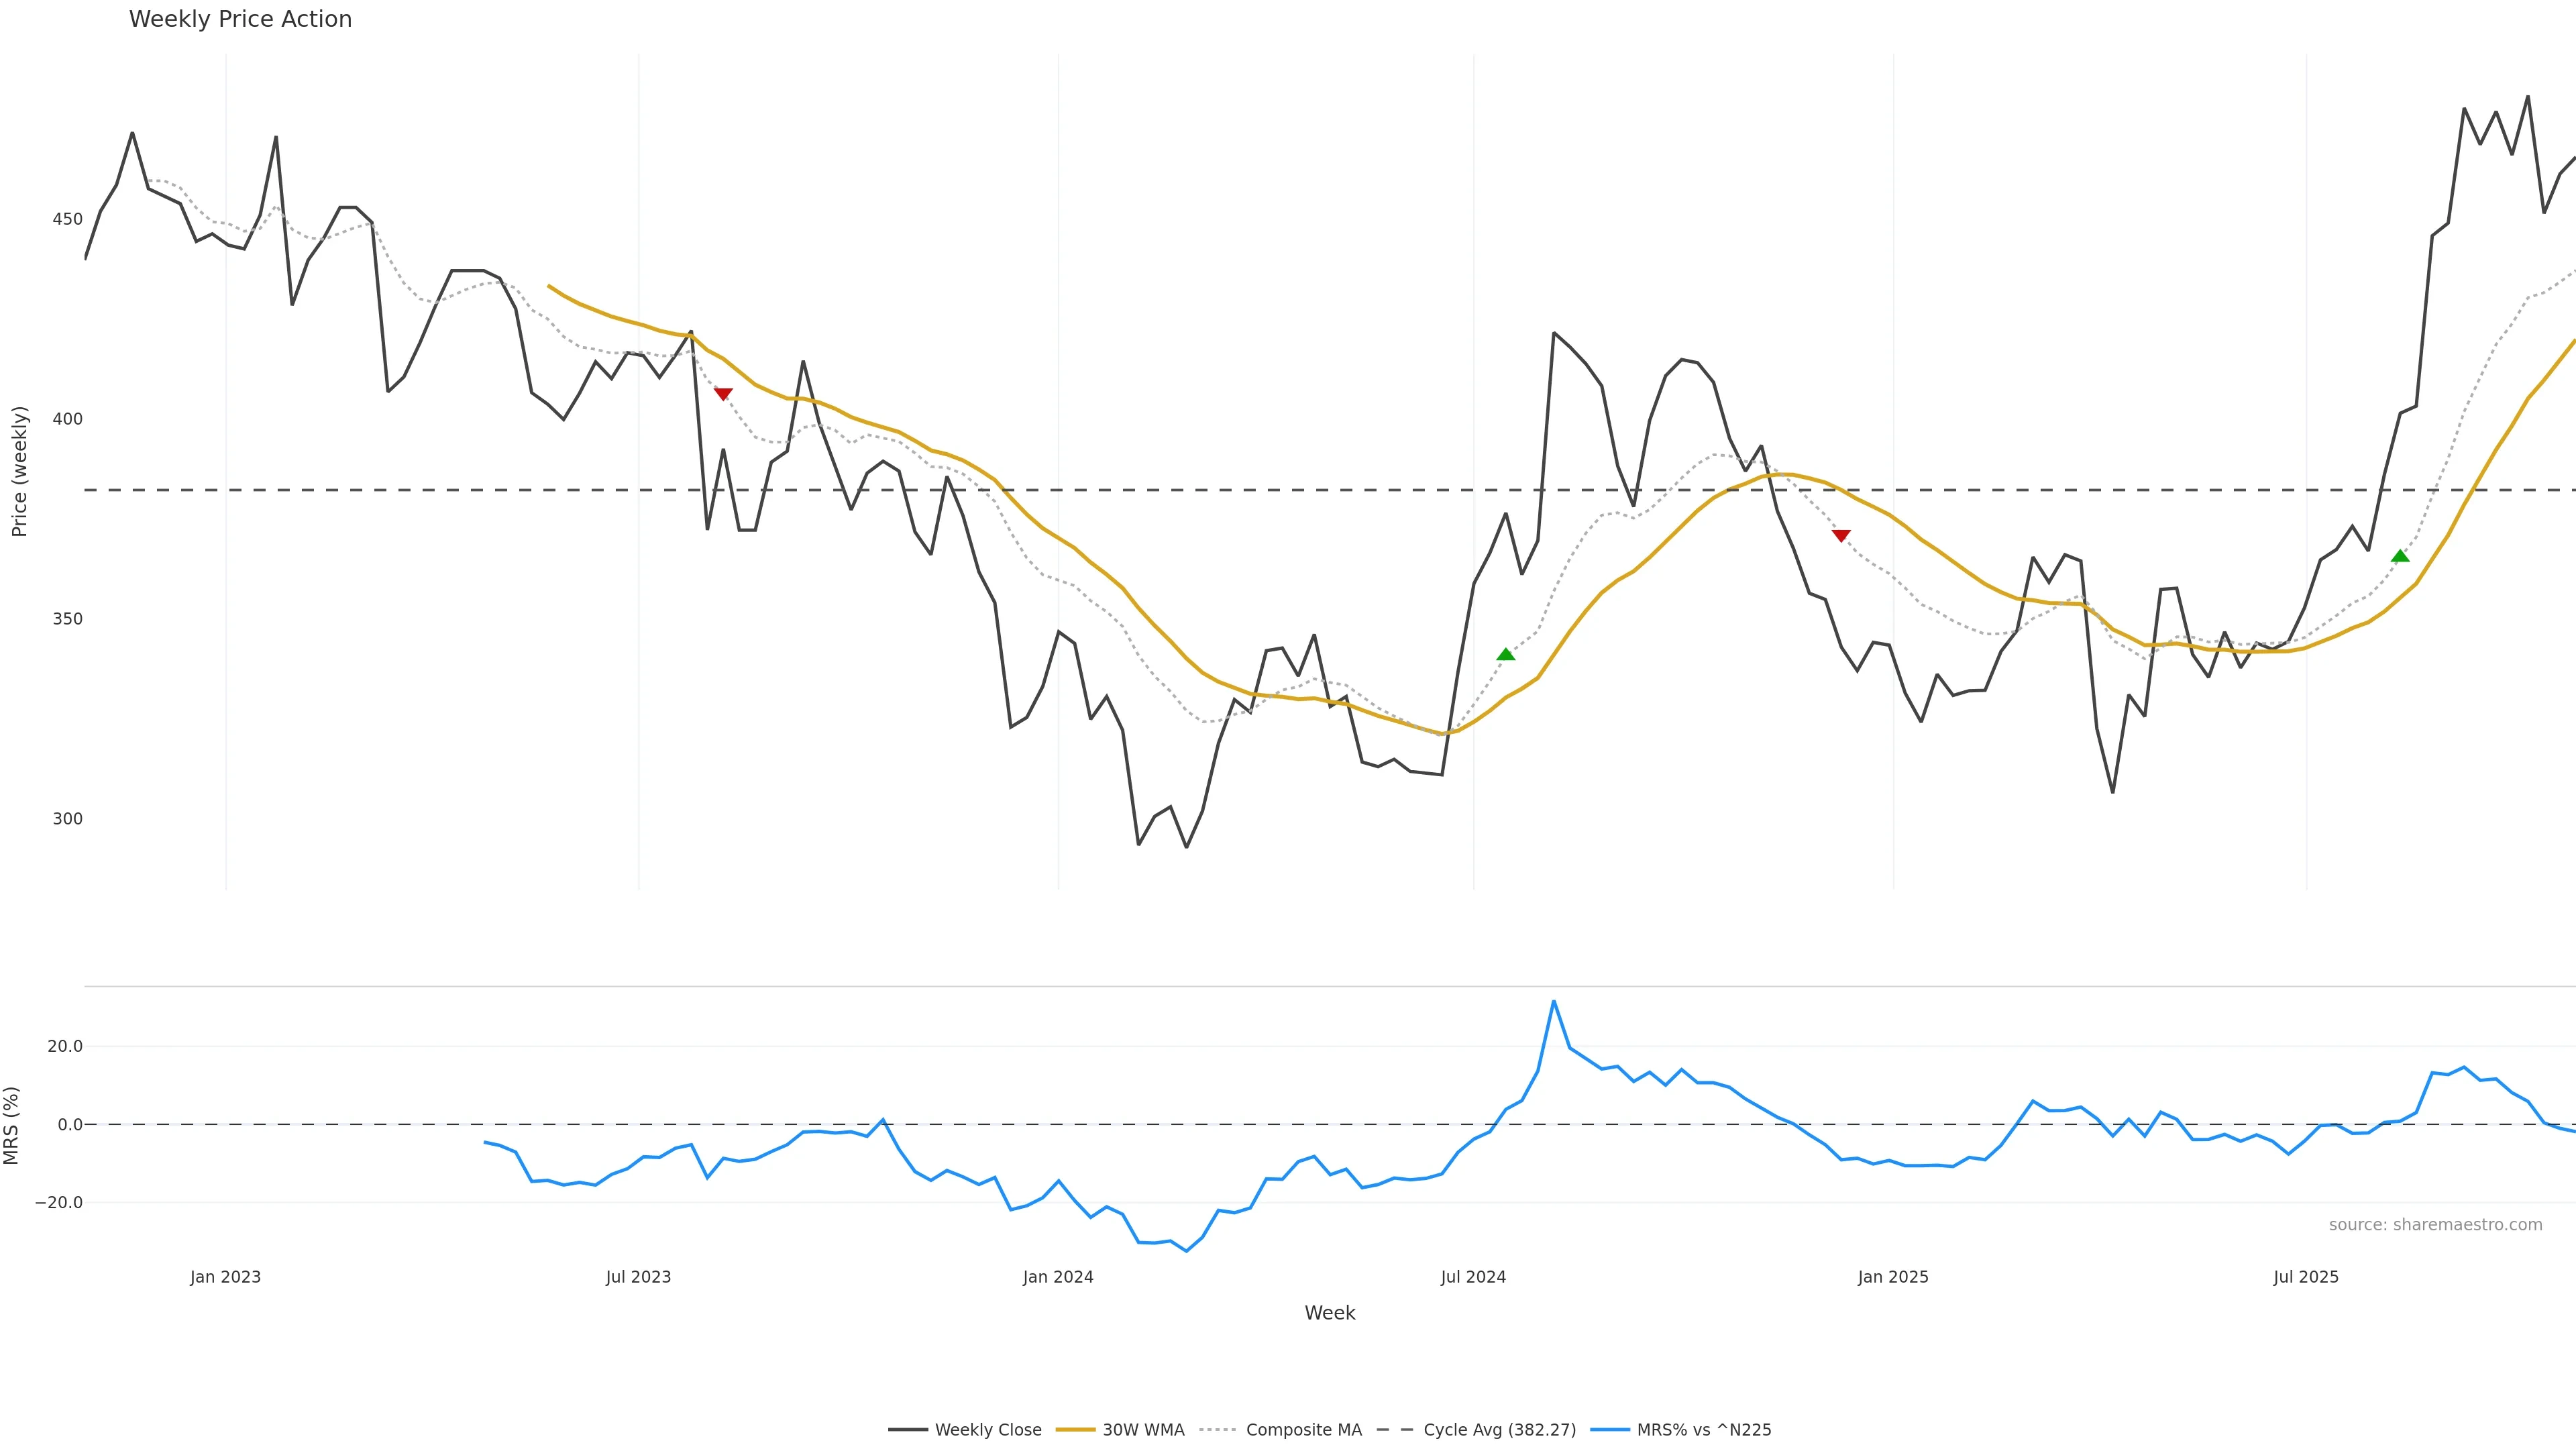
Market Cycle (Mean Reversion Context)
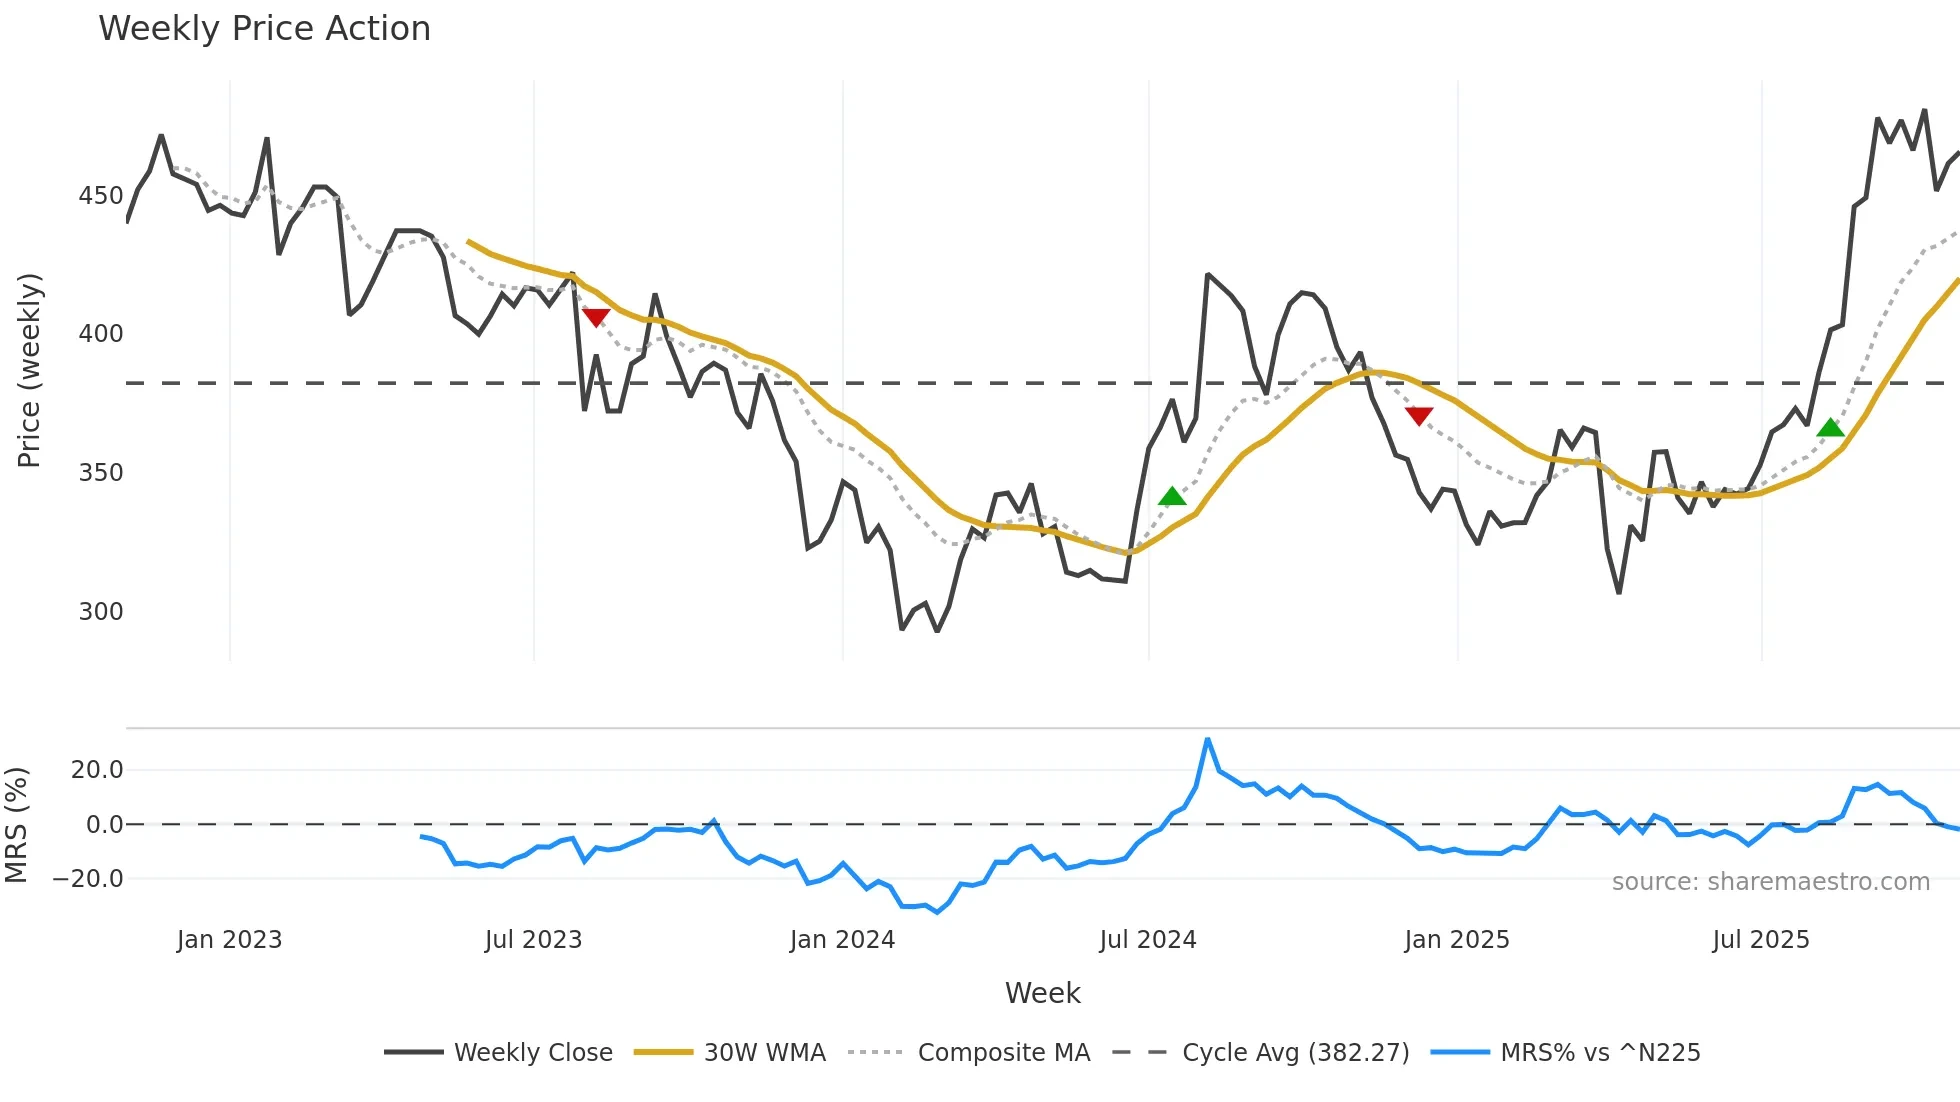
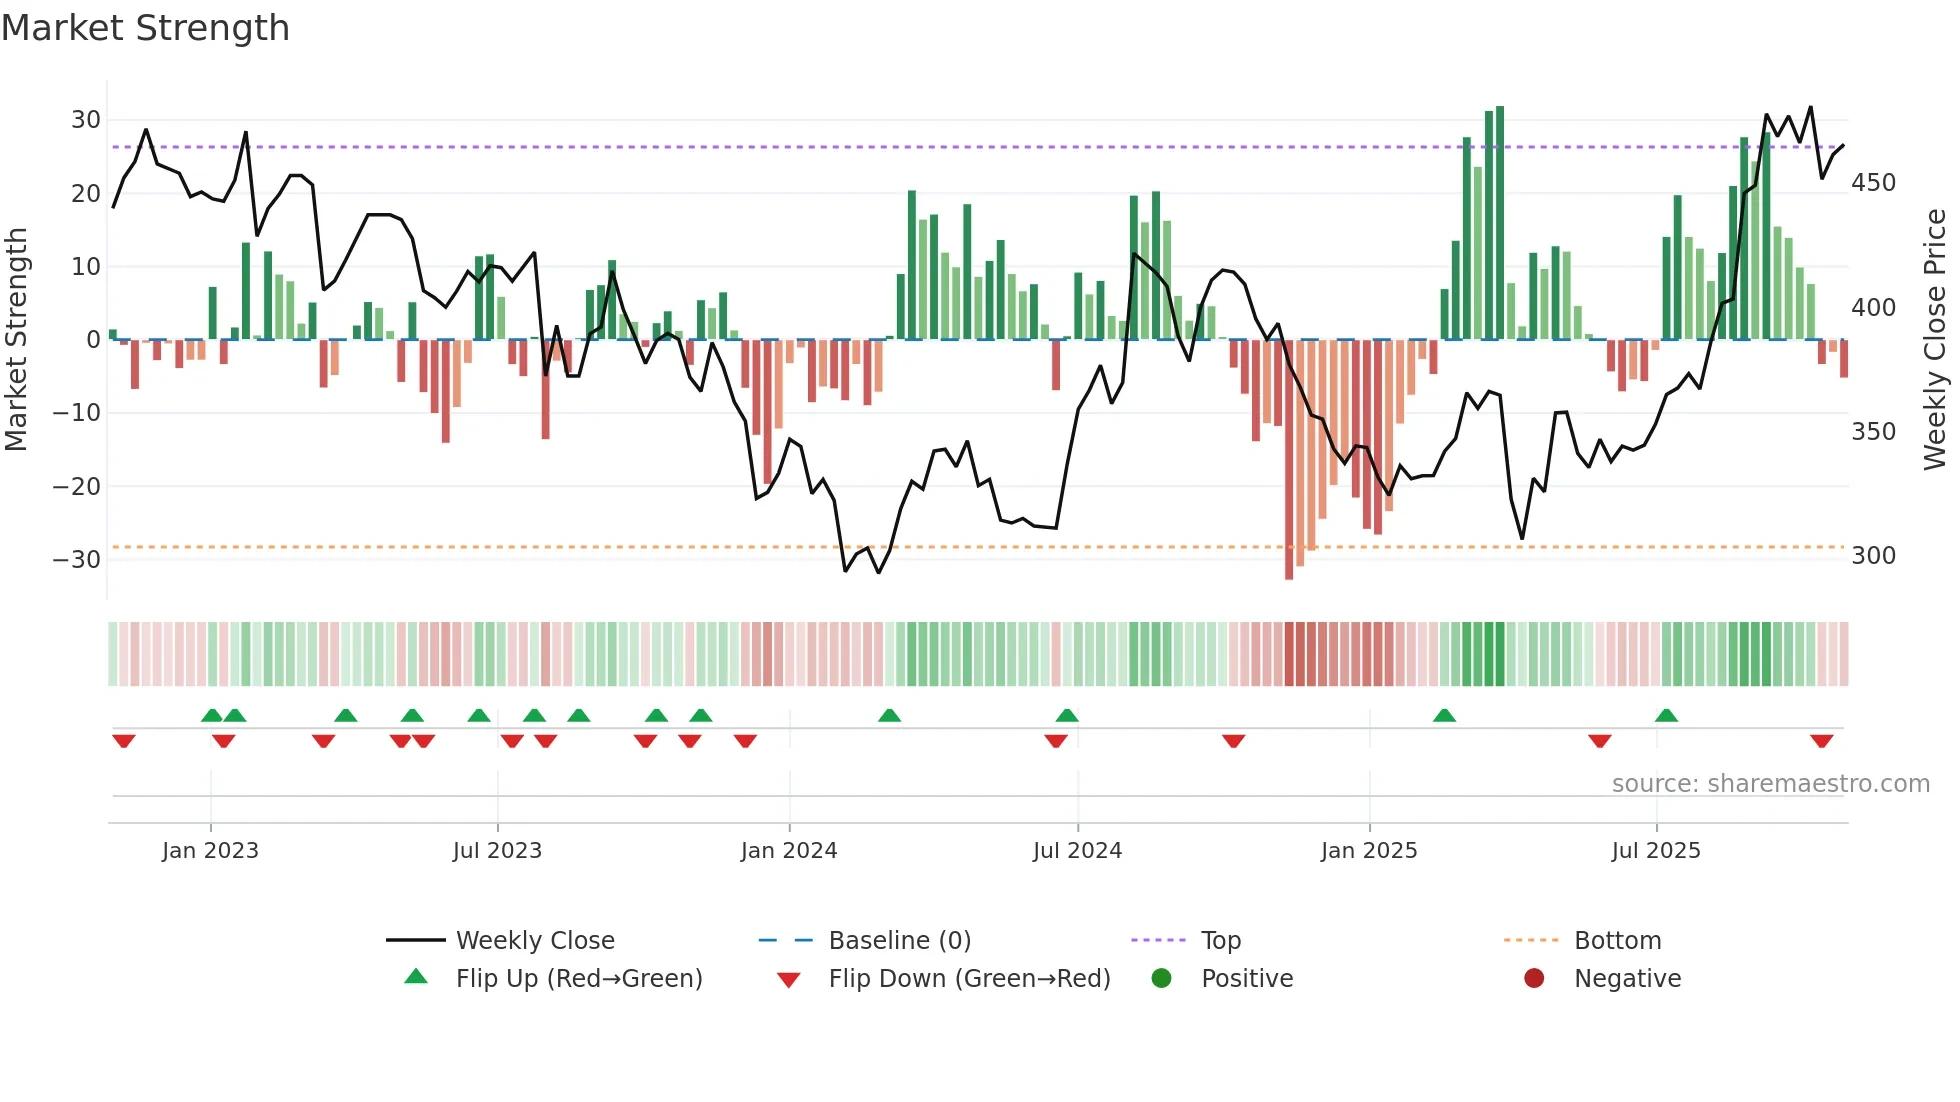
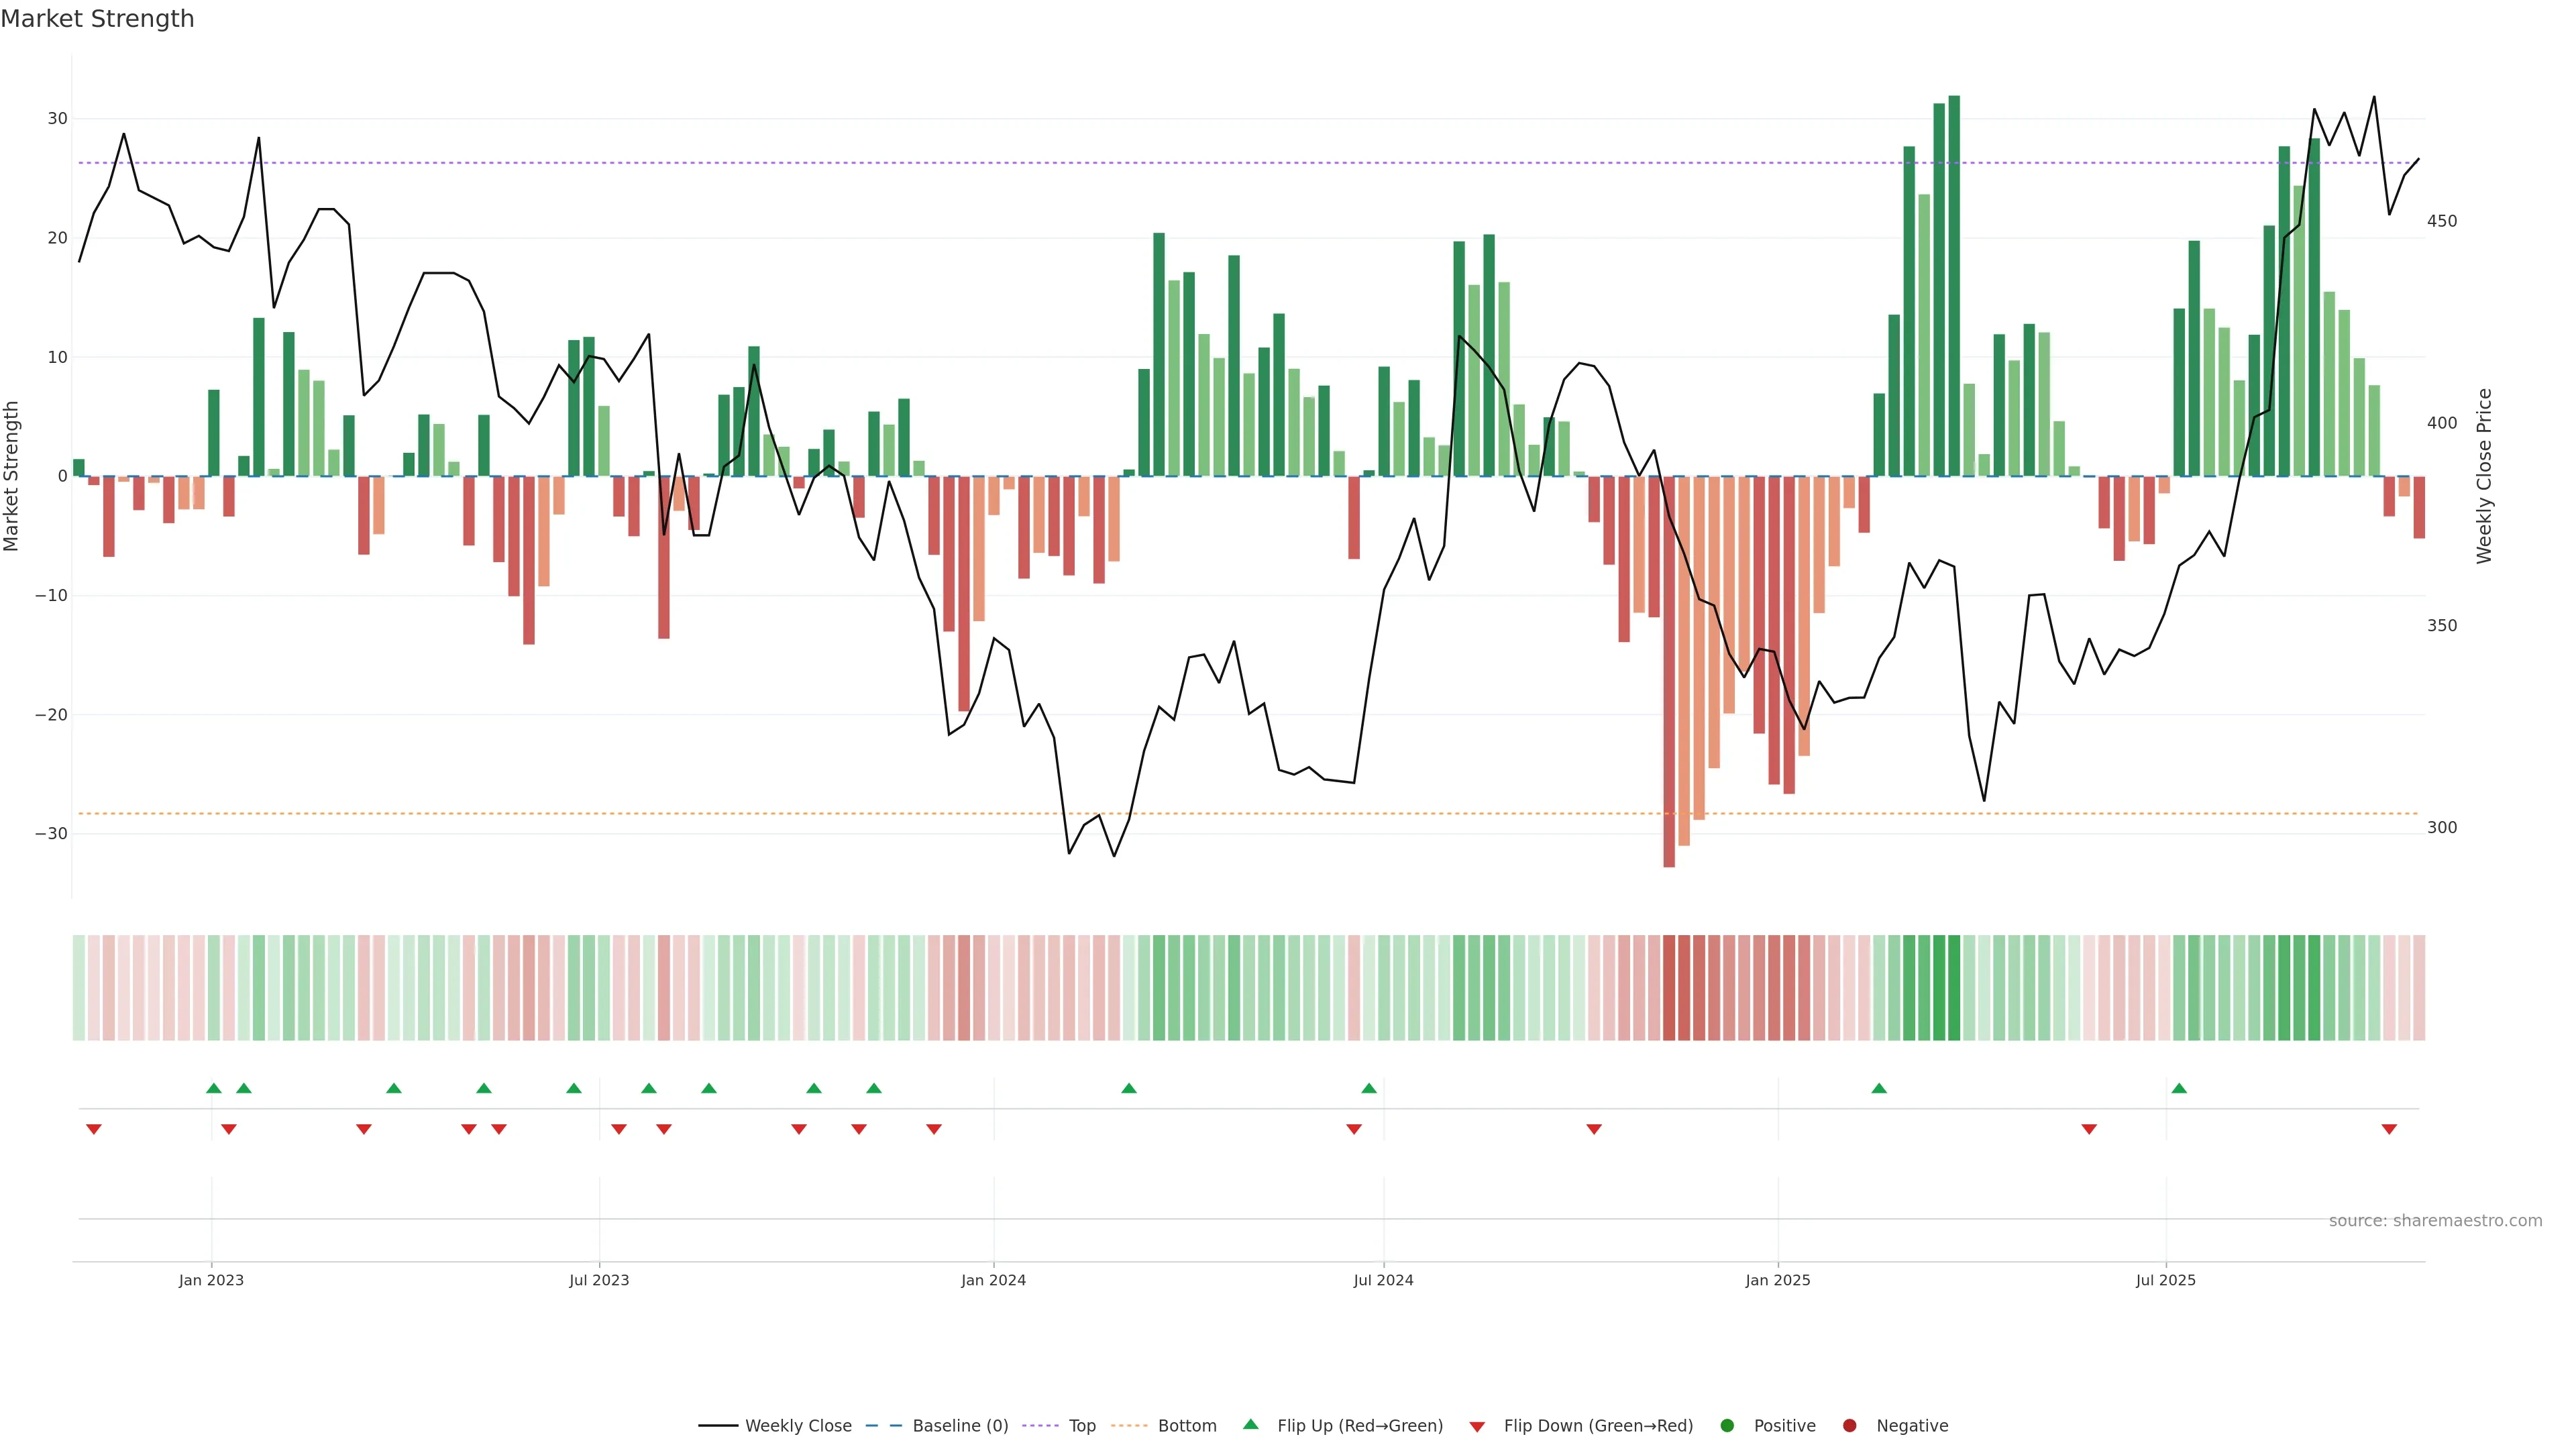
Cycle is near its top context while momentum fades. — Take profits into strength; risk of pullback.
Score -0.4
+0 / -1
Level 21.797
Cycle is near its top context while momentum fades.
Cycle is near its top context while momentum fades. Take profits into strength; risk of pullback. In essence this reflects mean-reversion posture and cycle slope with a bearish tilt.
pol -0.4
conf 0.55
moderate · medium
What it means
Cycle is near its top context while momentum fades. Take profits into strength; risk of pullback. In essence this reflects mean-reversion posture and cycle slope with a bearish tilt.
Implications
Raises risk of failed breakouts; strength must prove itself on closes. Context: level 21.80. (pol -0.40, conf 0.55 → moderate/medium)
No additional observations.