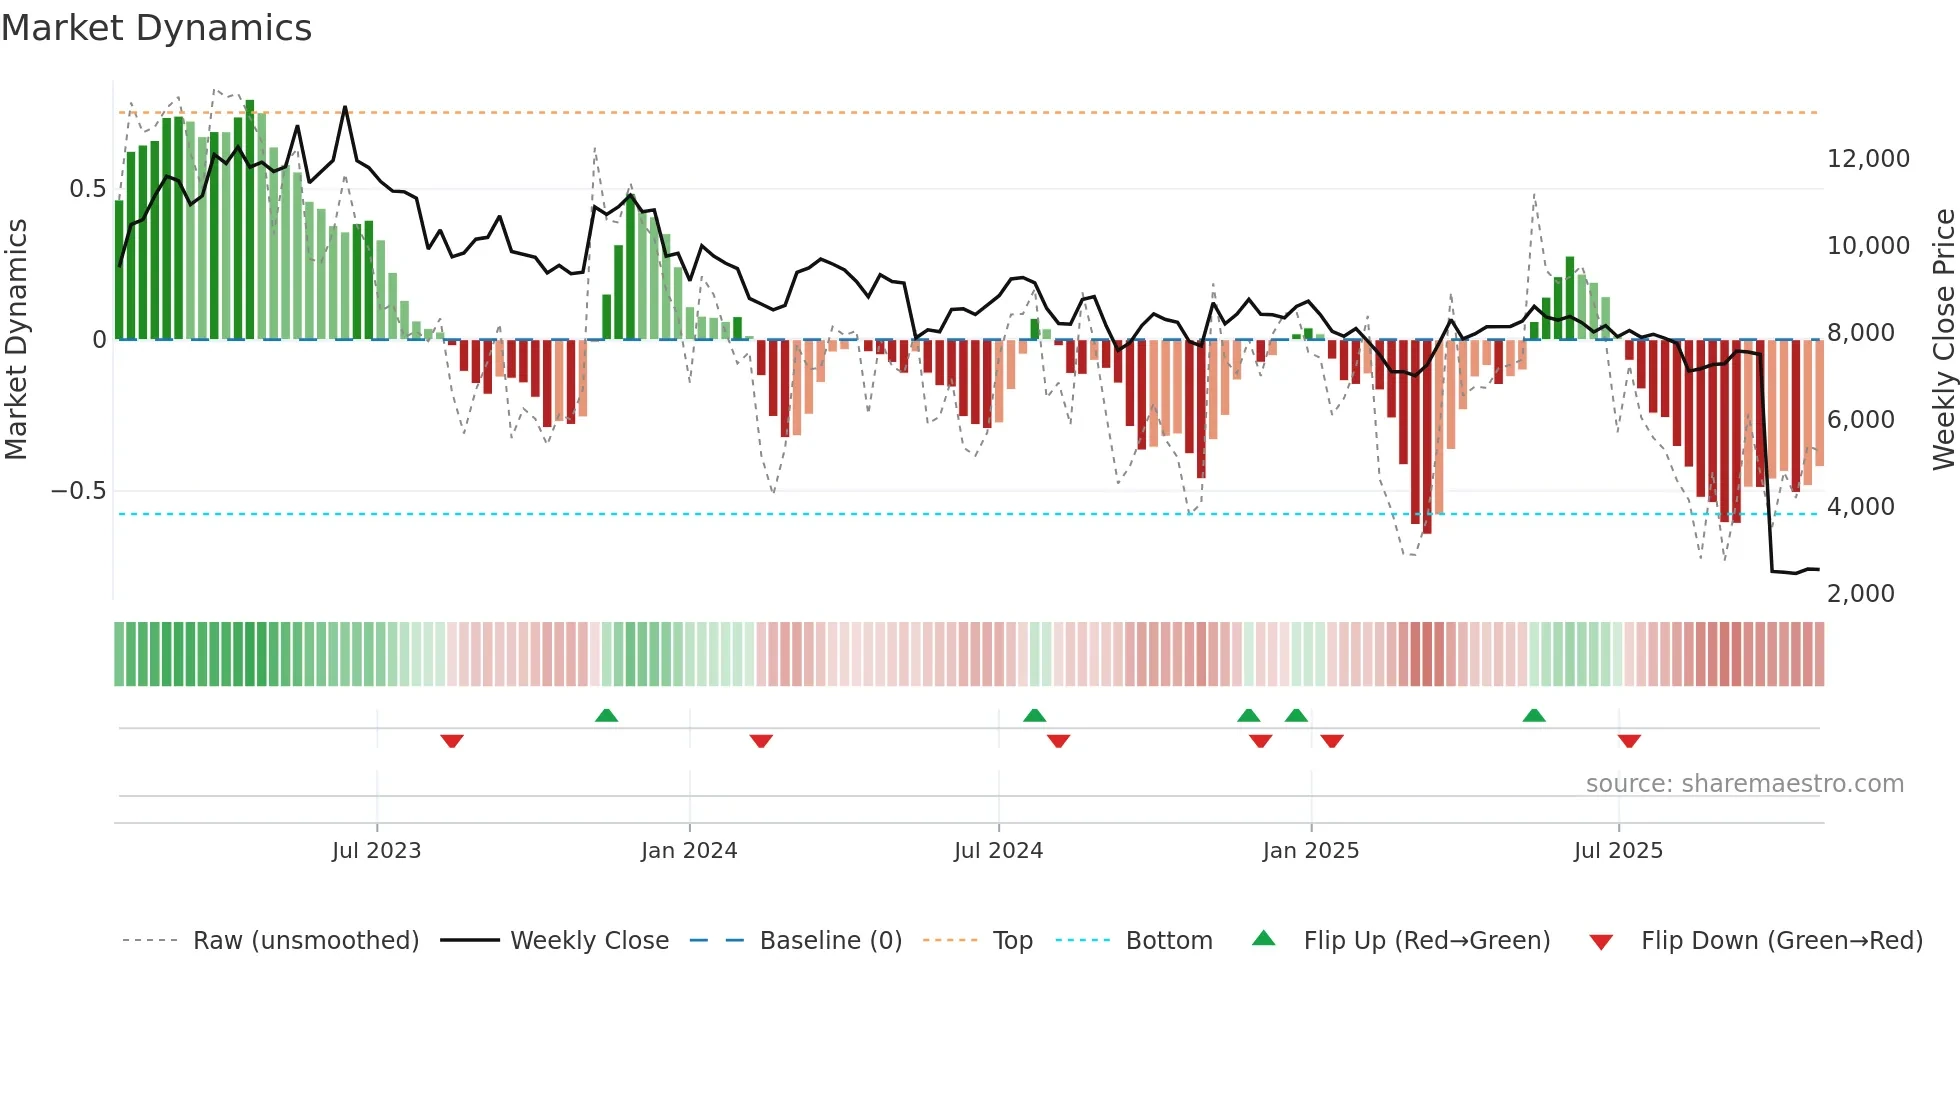
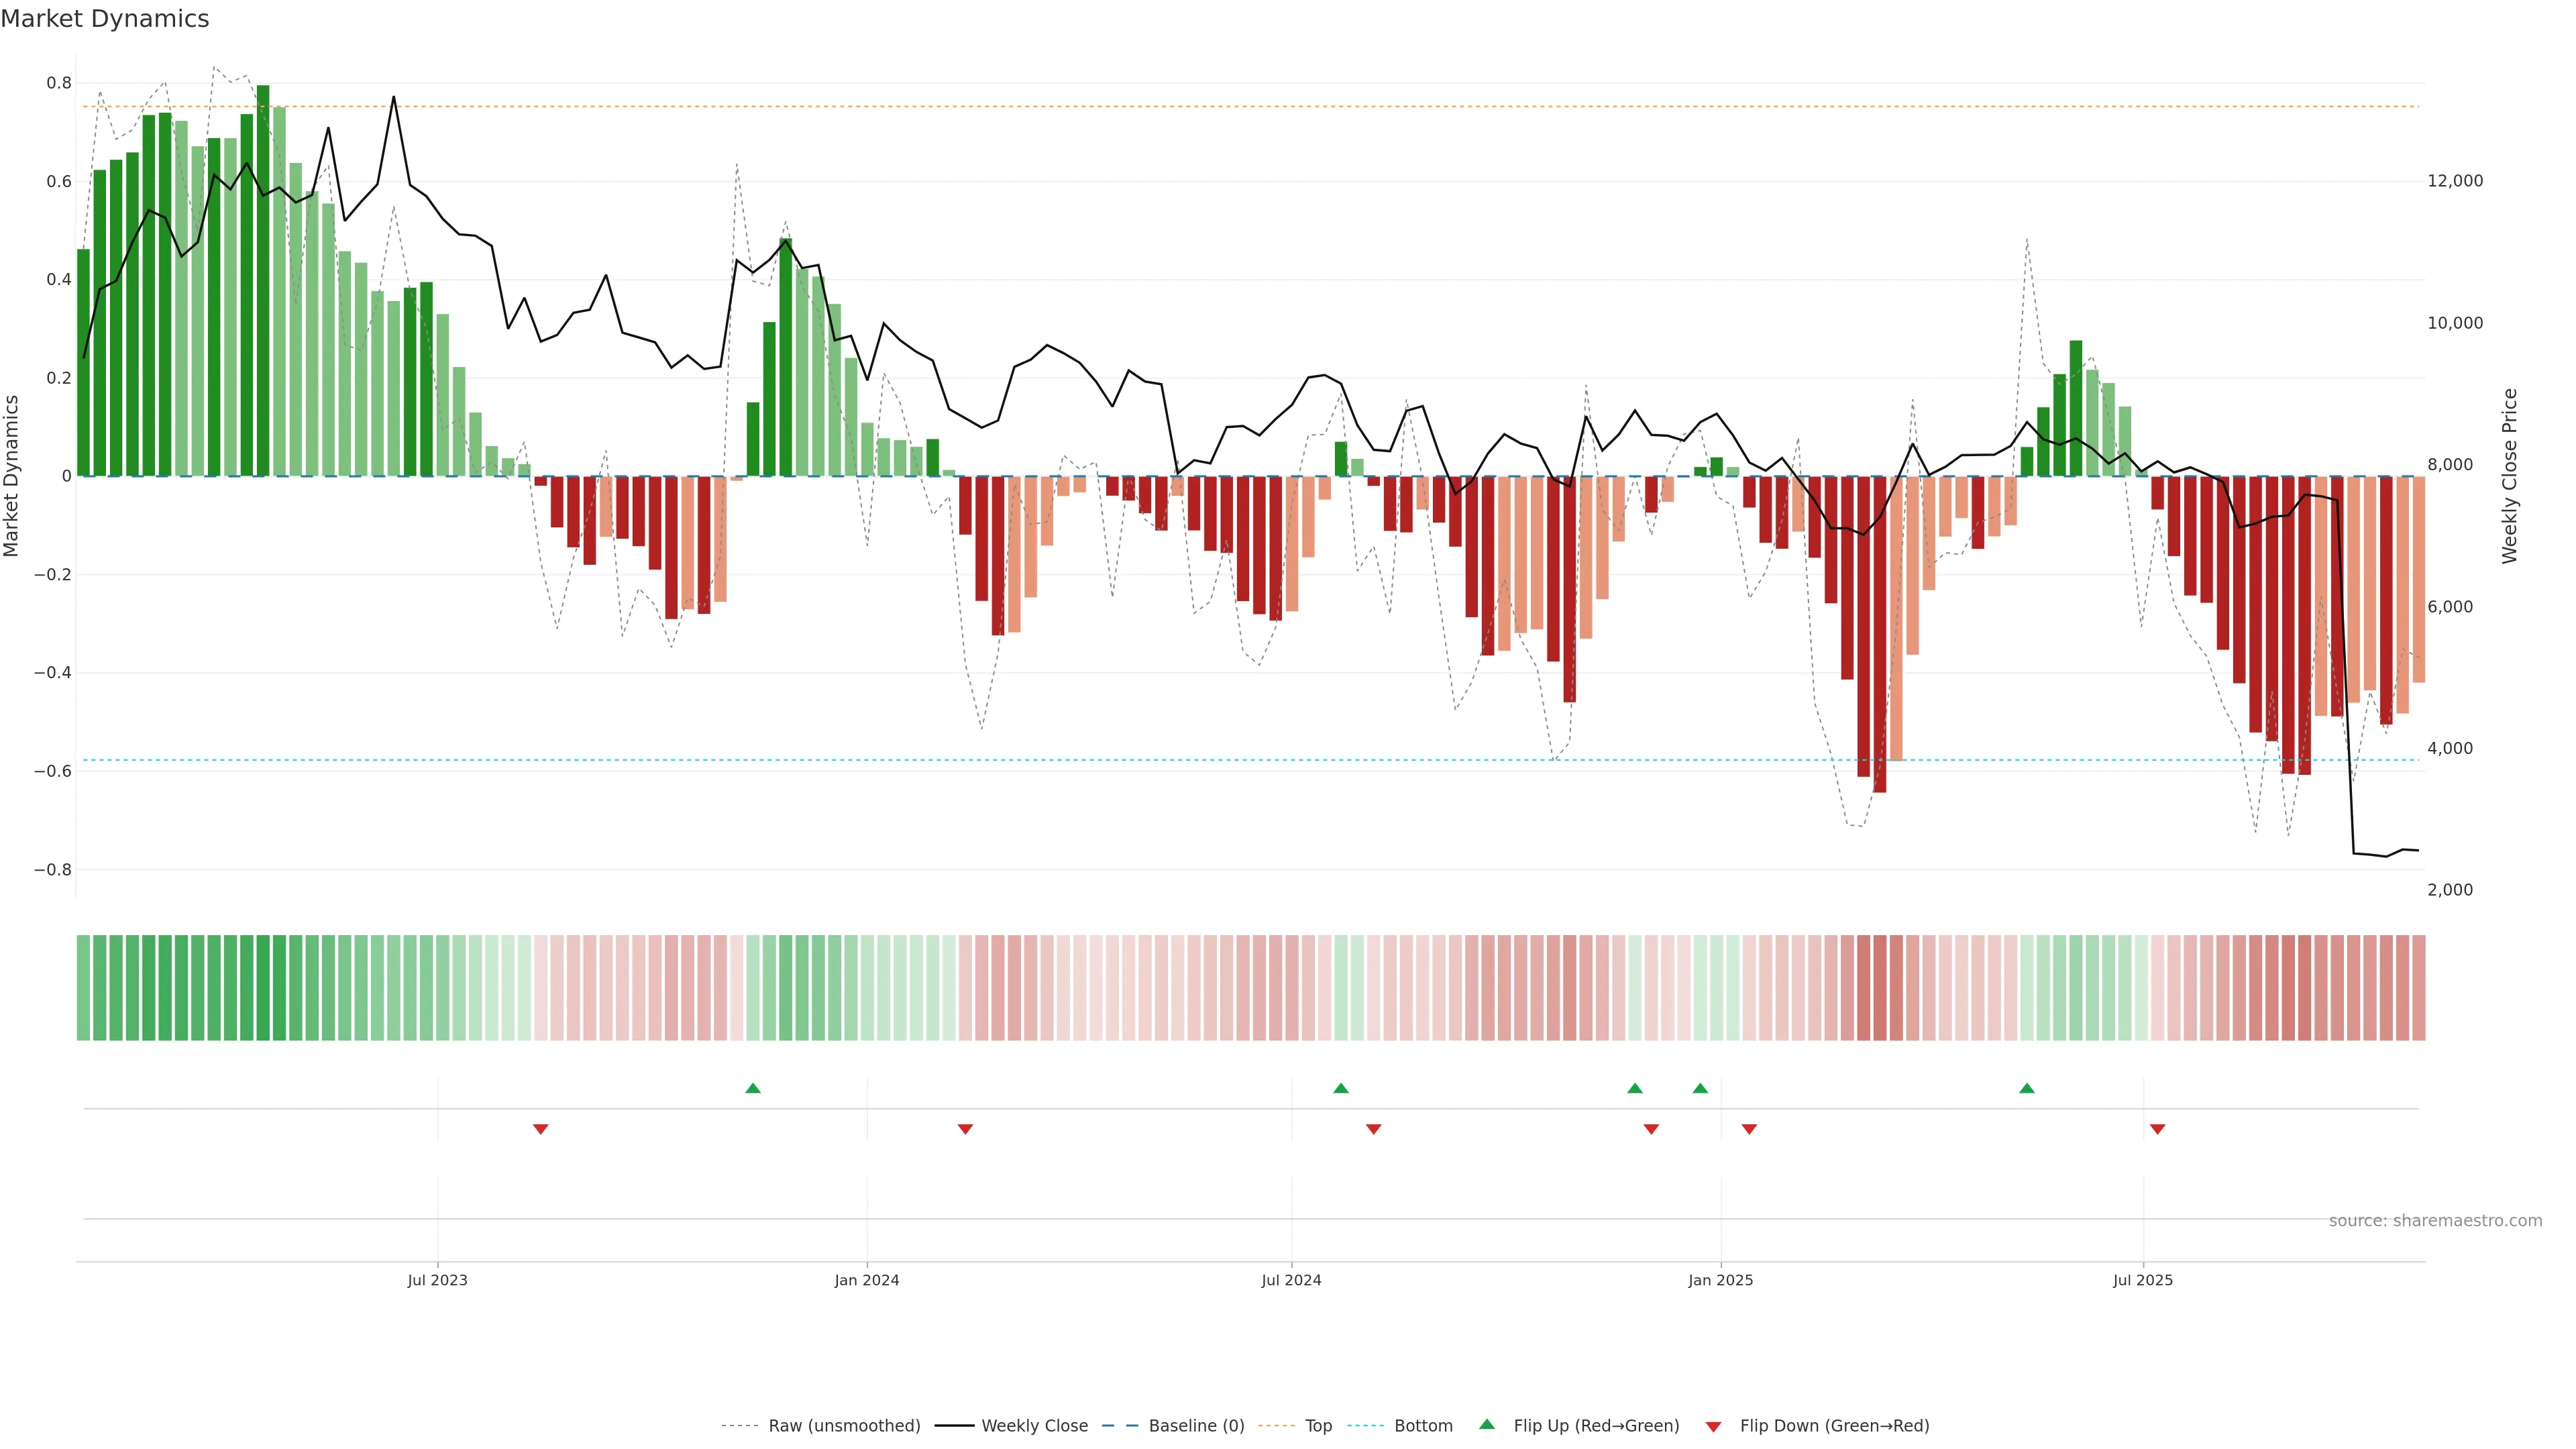
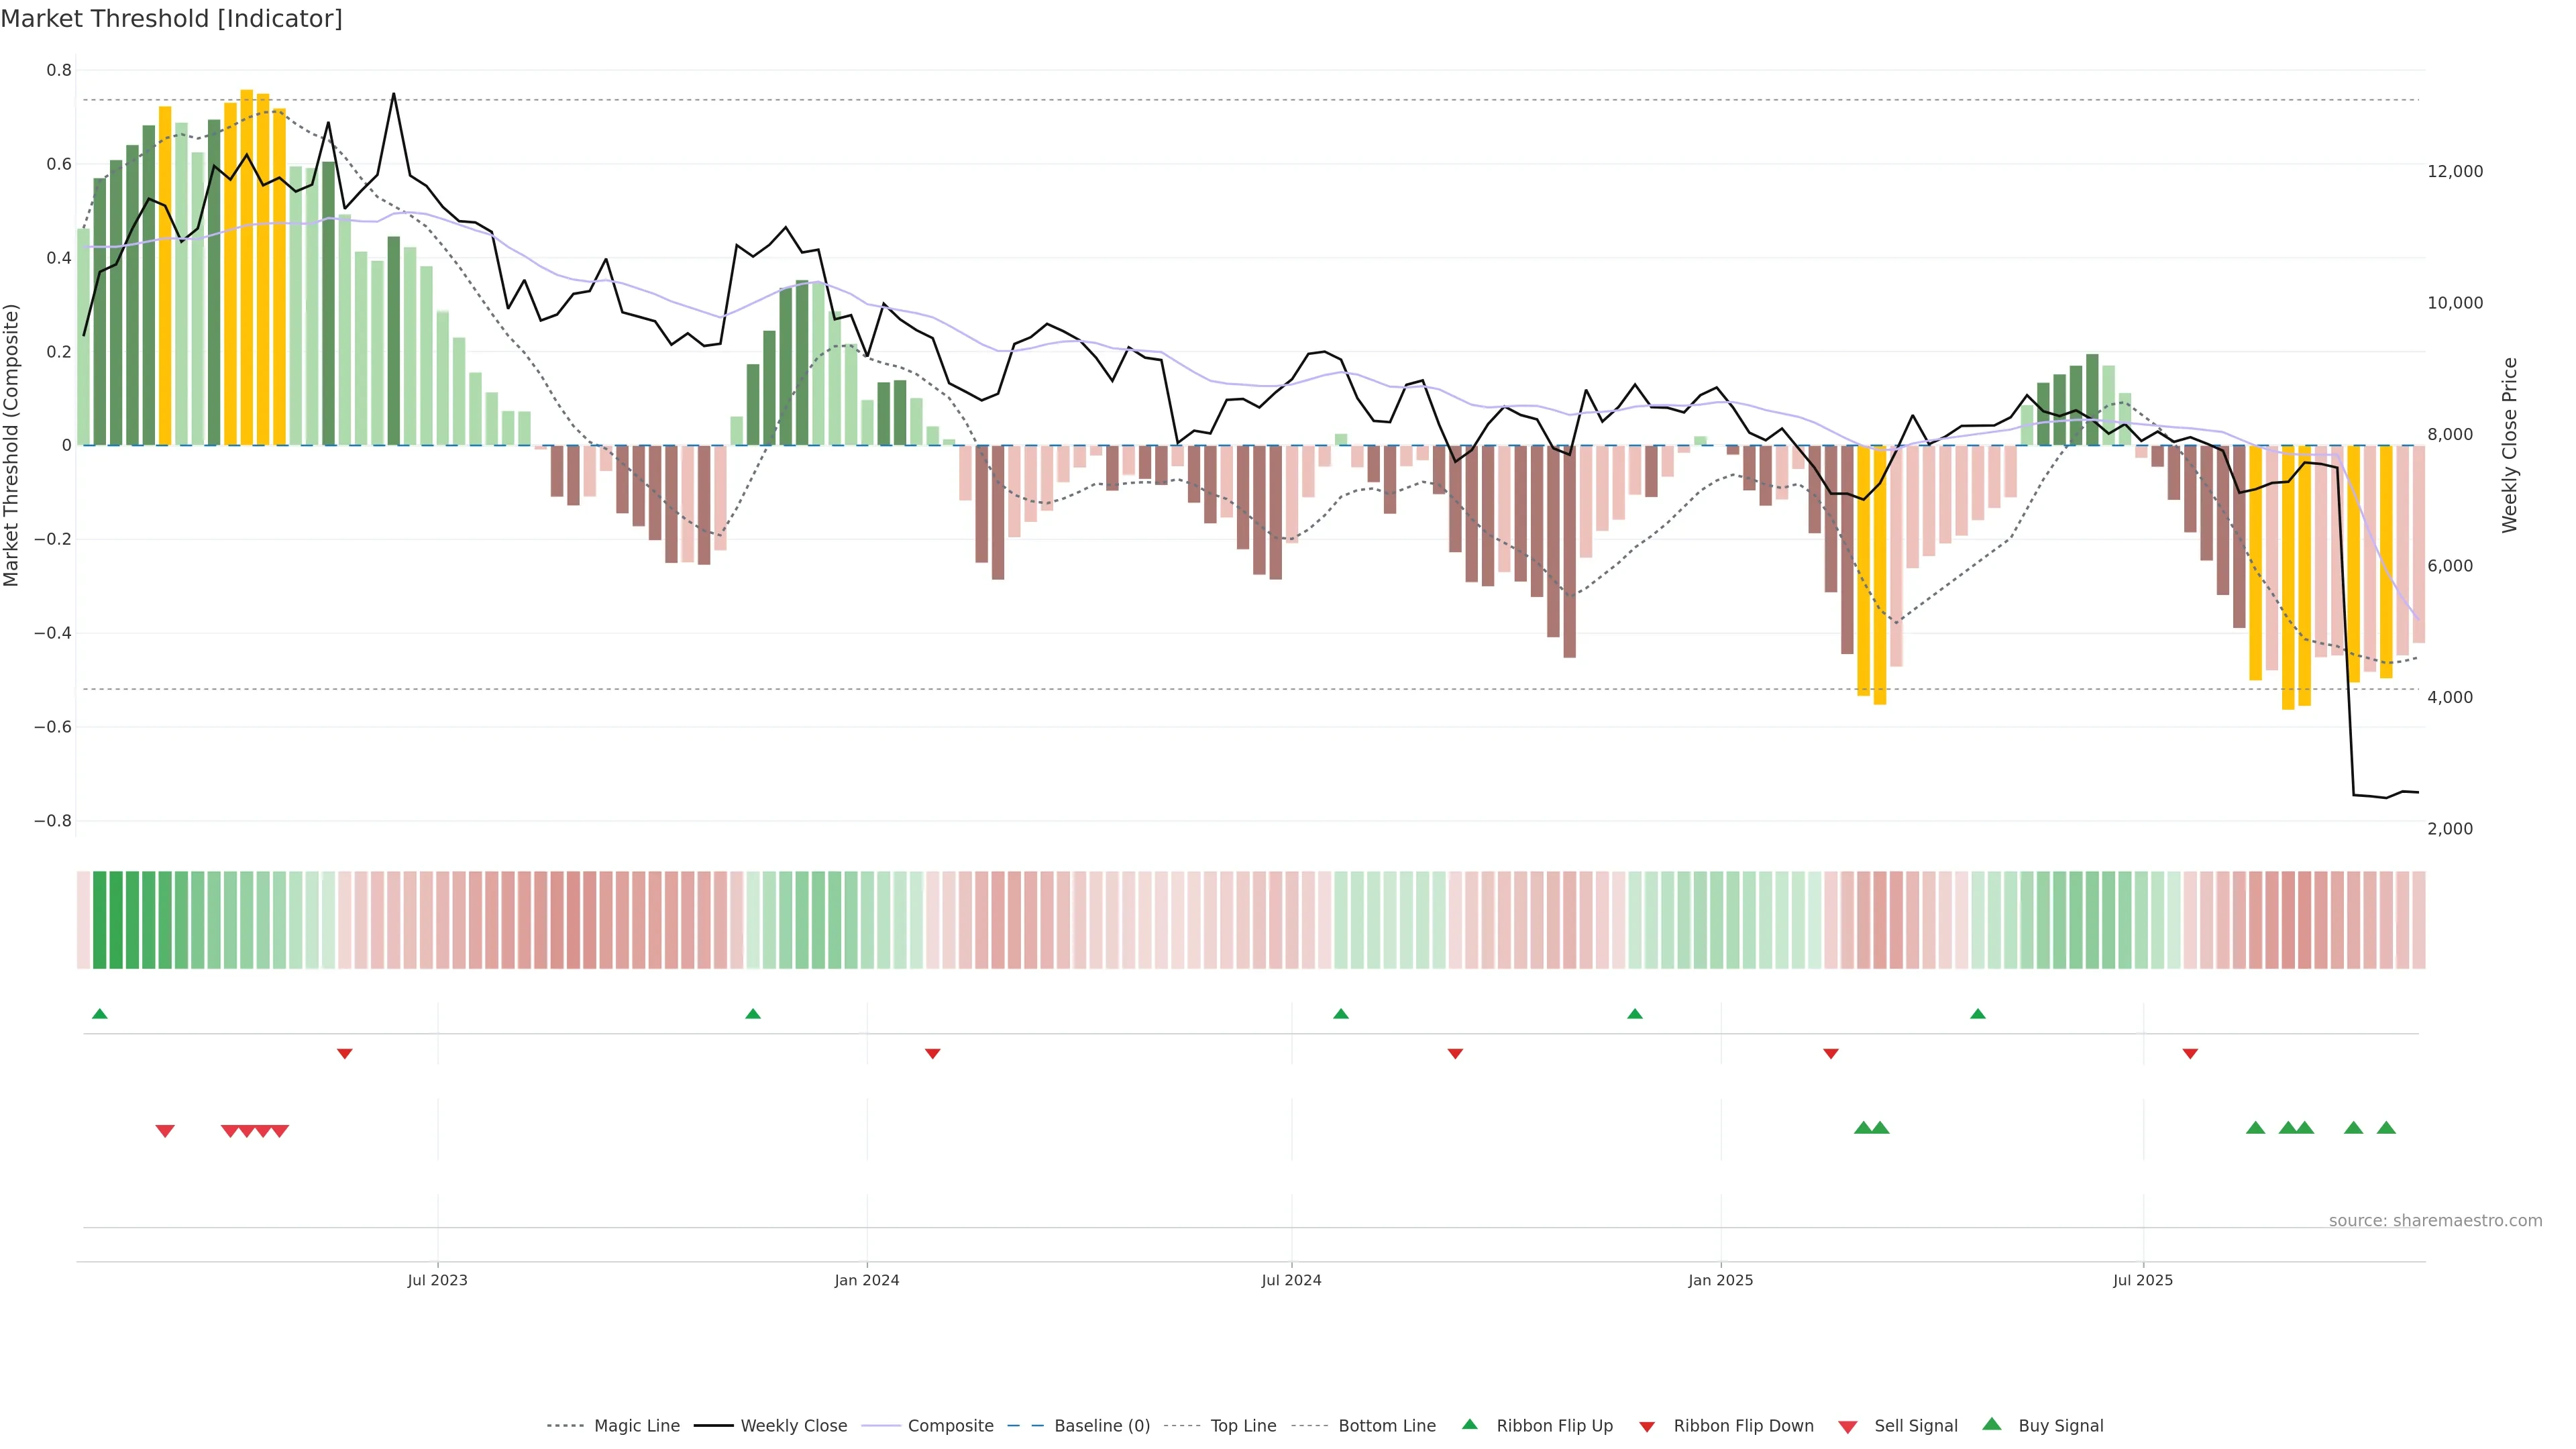
Market Dynamics
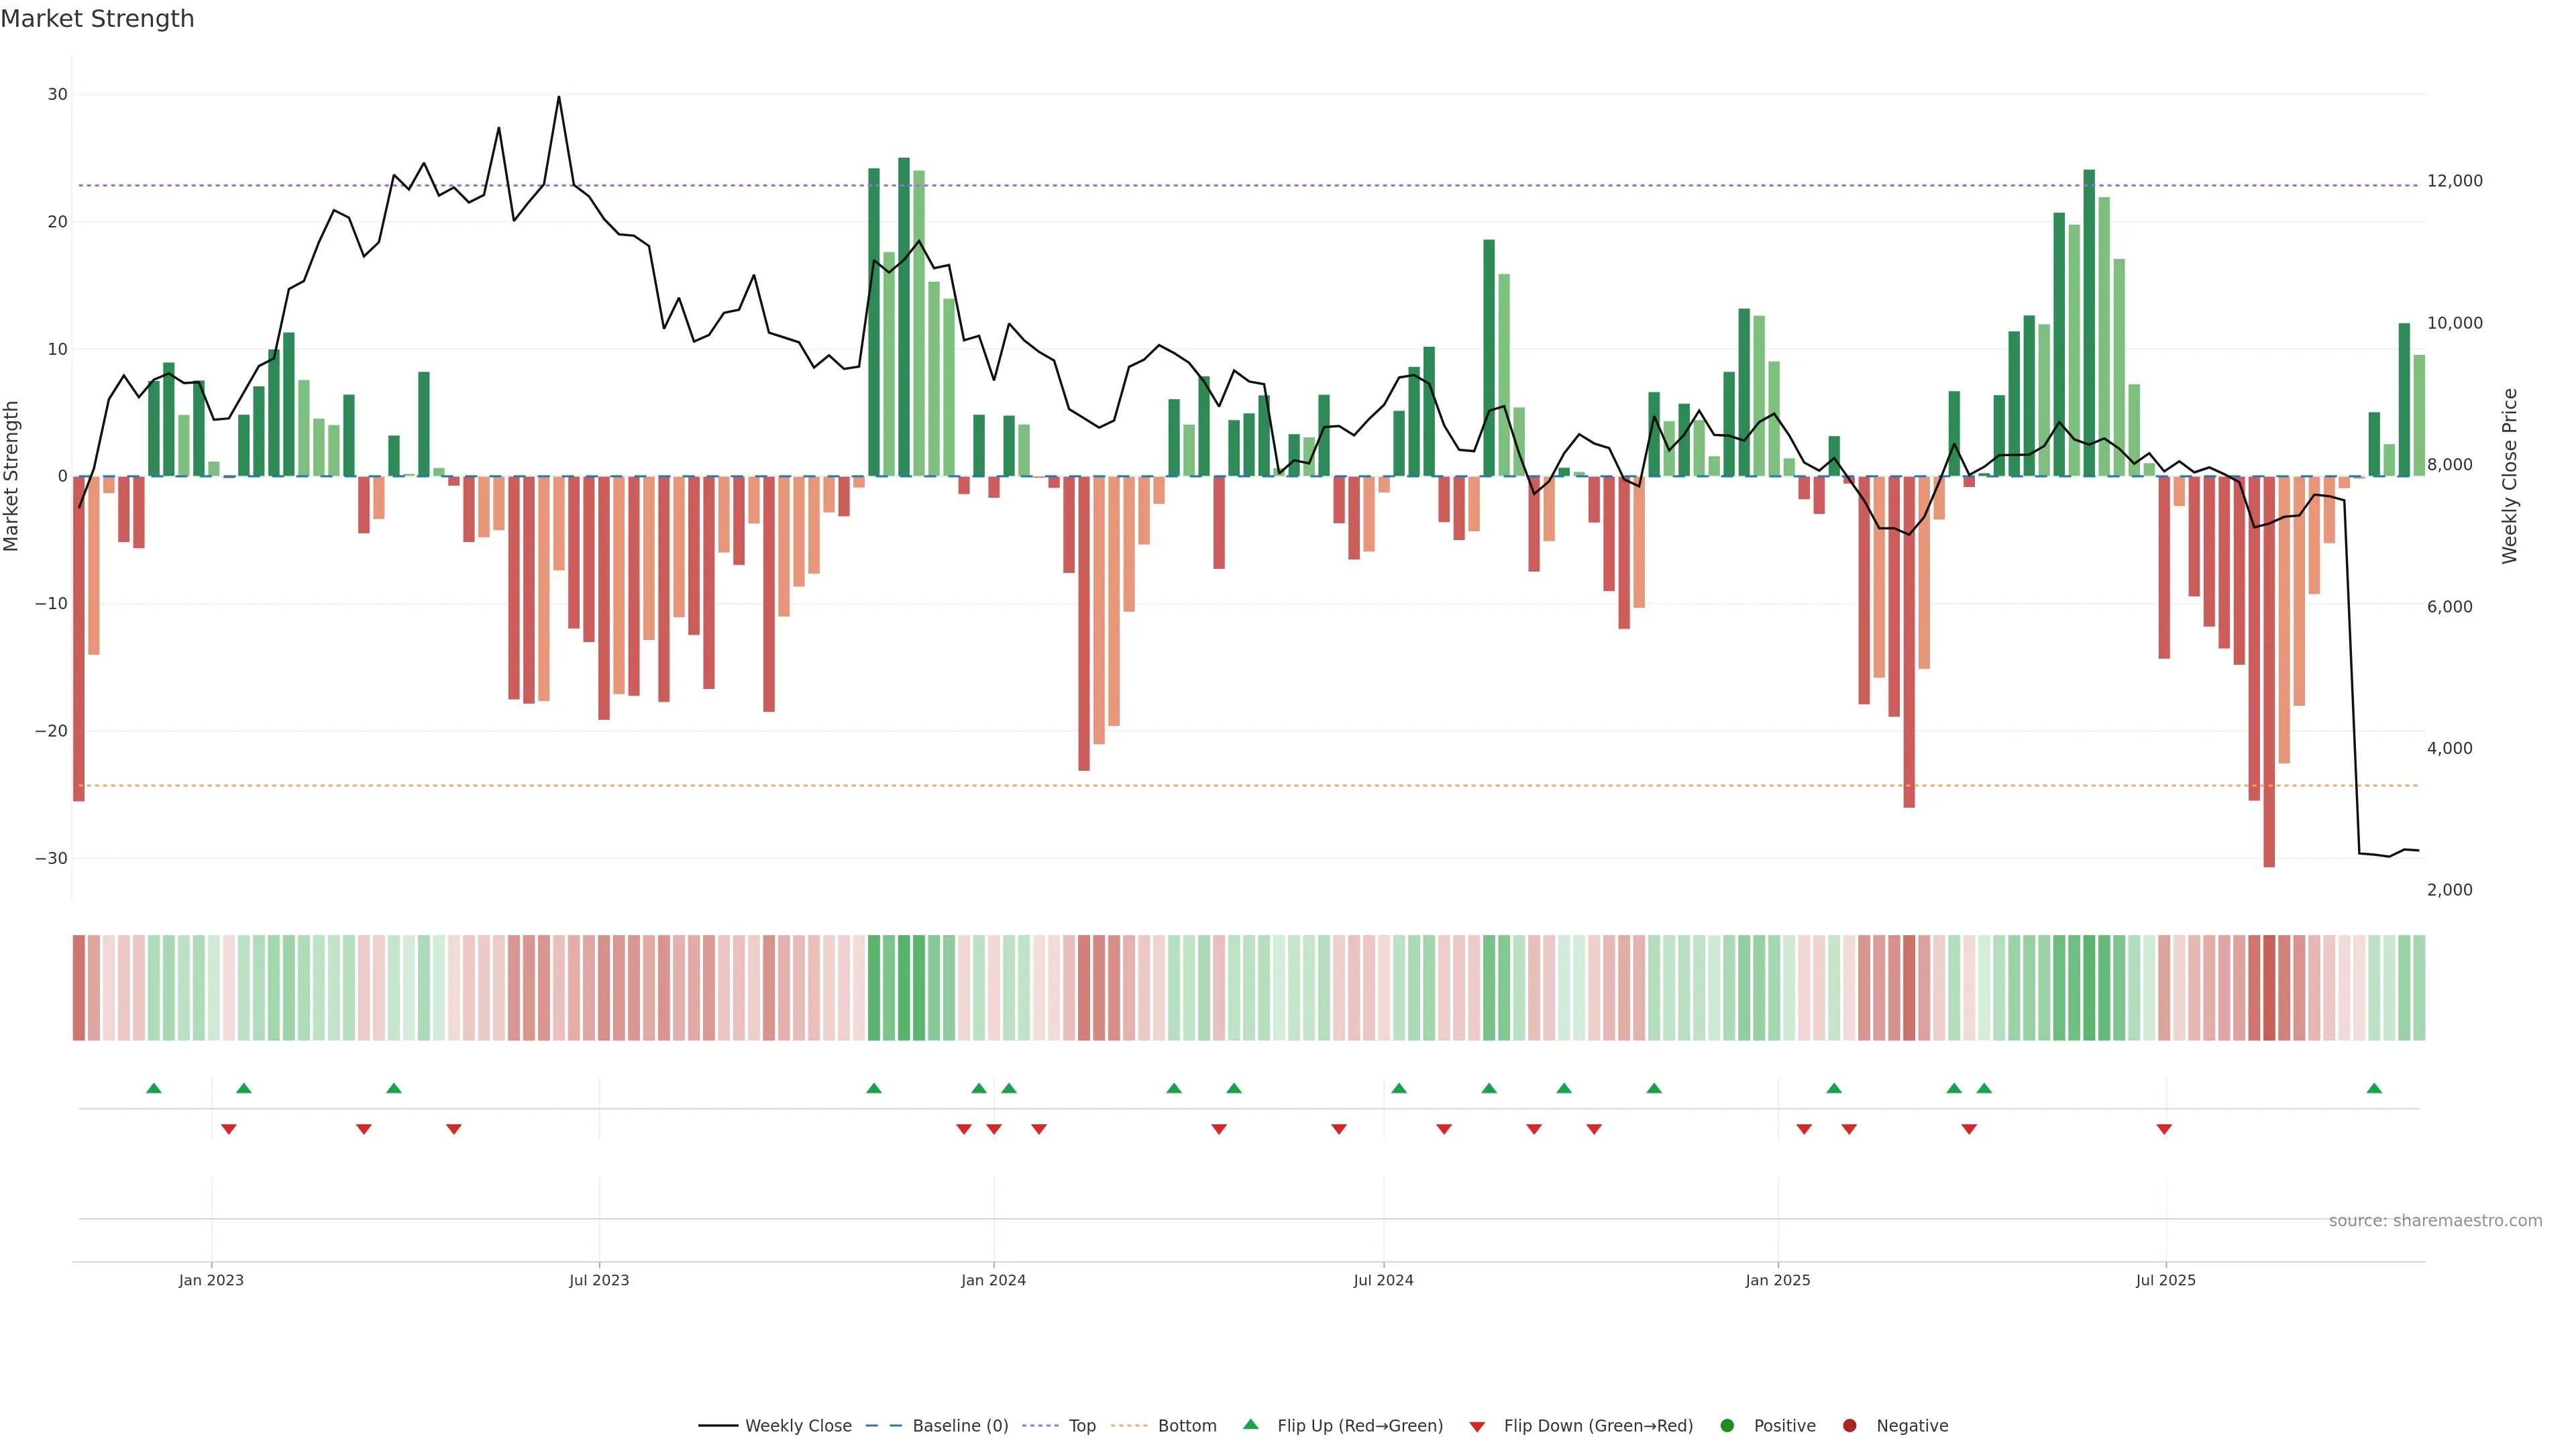
Dynamics turning up from negative territory. — Early trend repair often precedes price strength.
Score 0.7
+2 / -0
Level -0.420
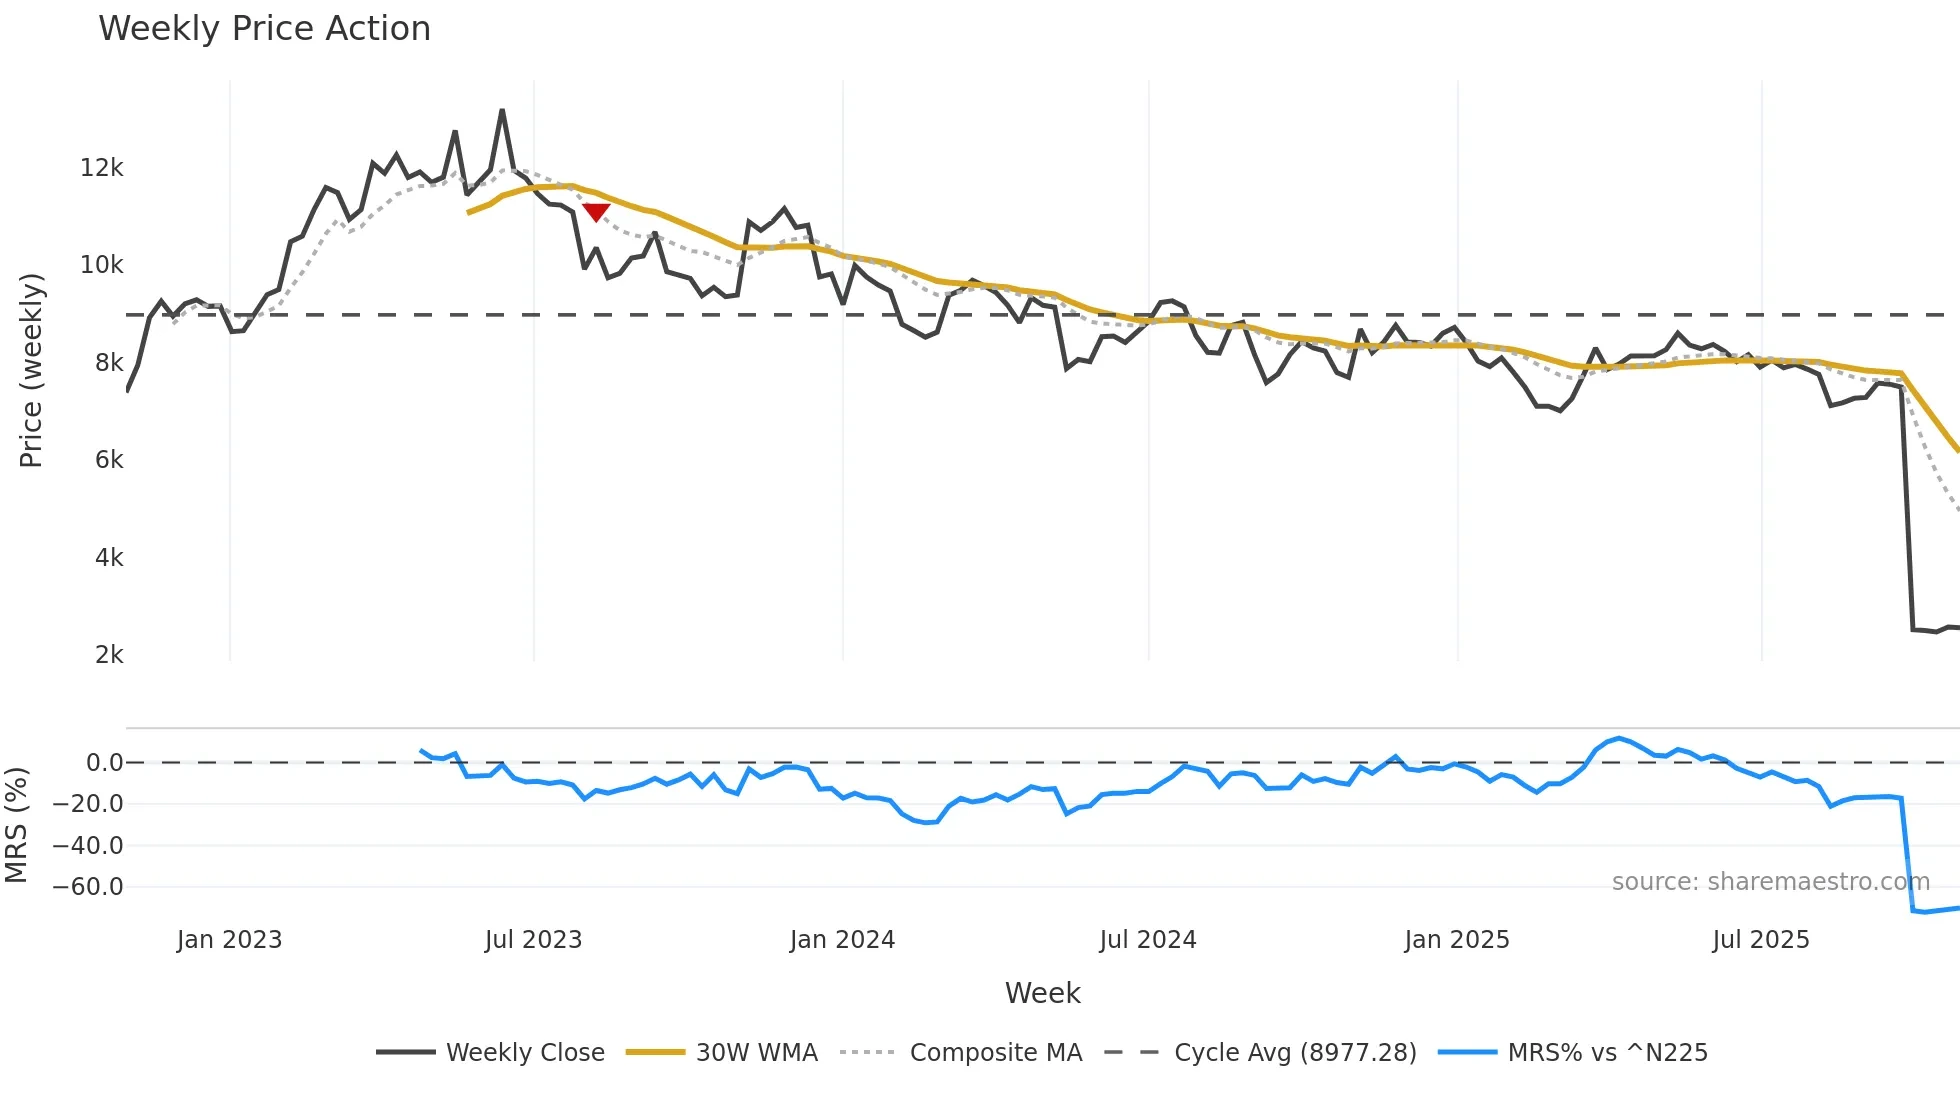
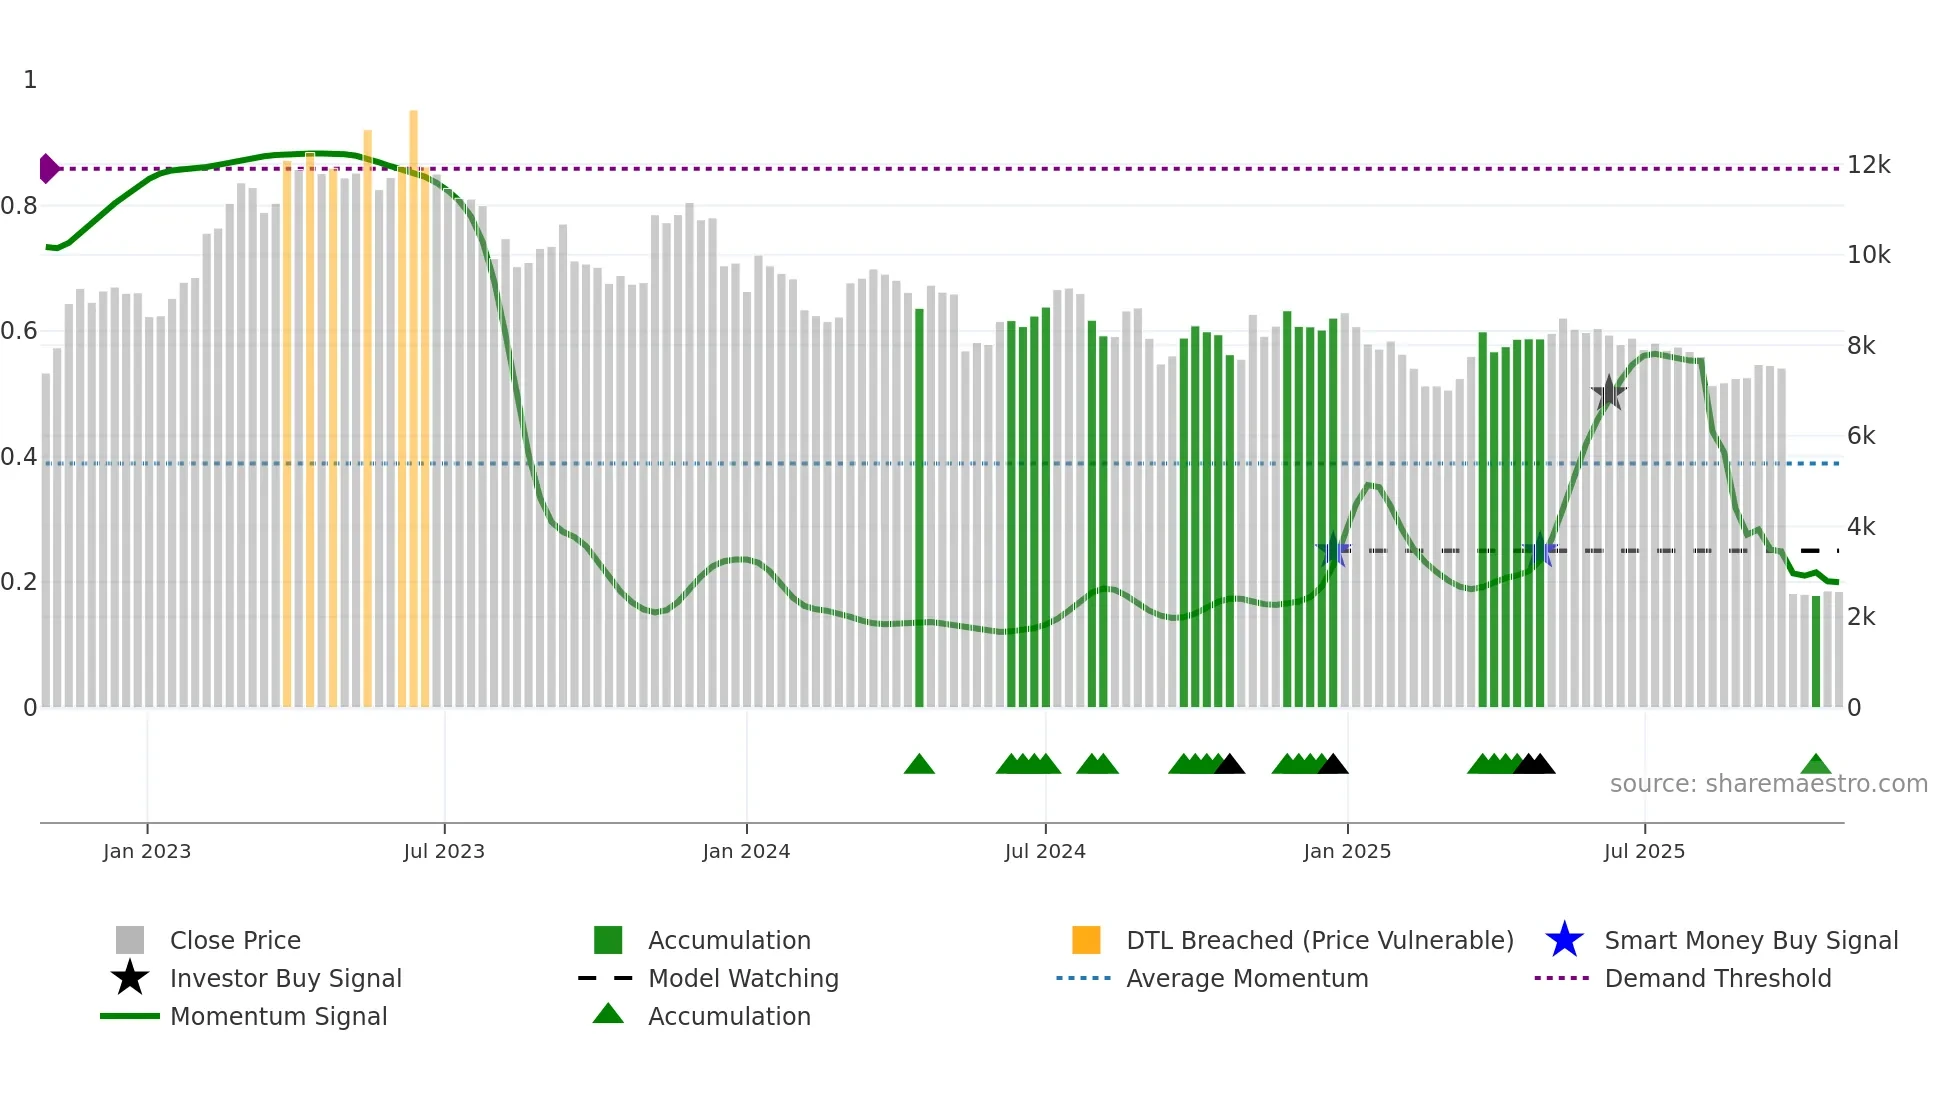
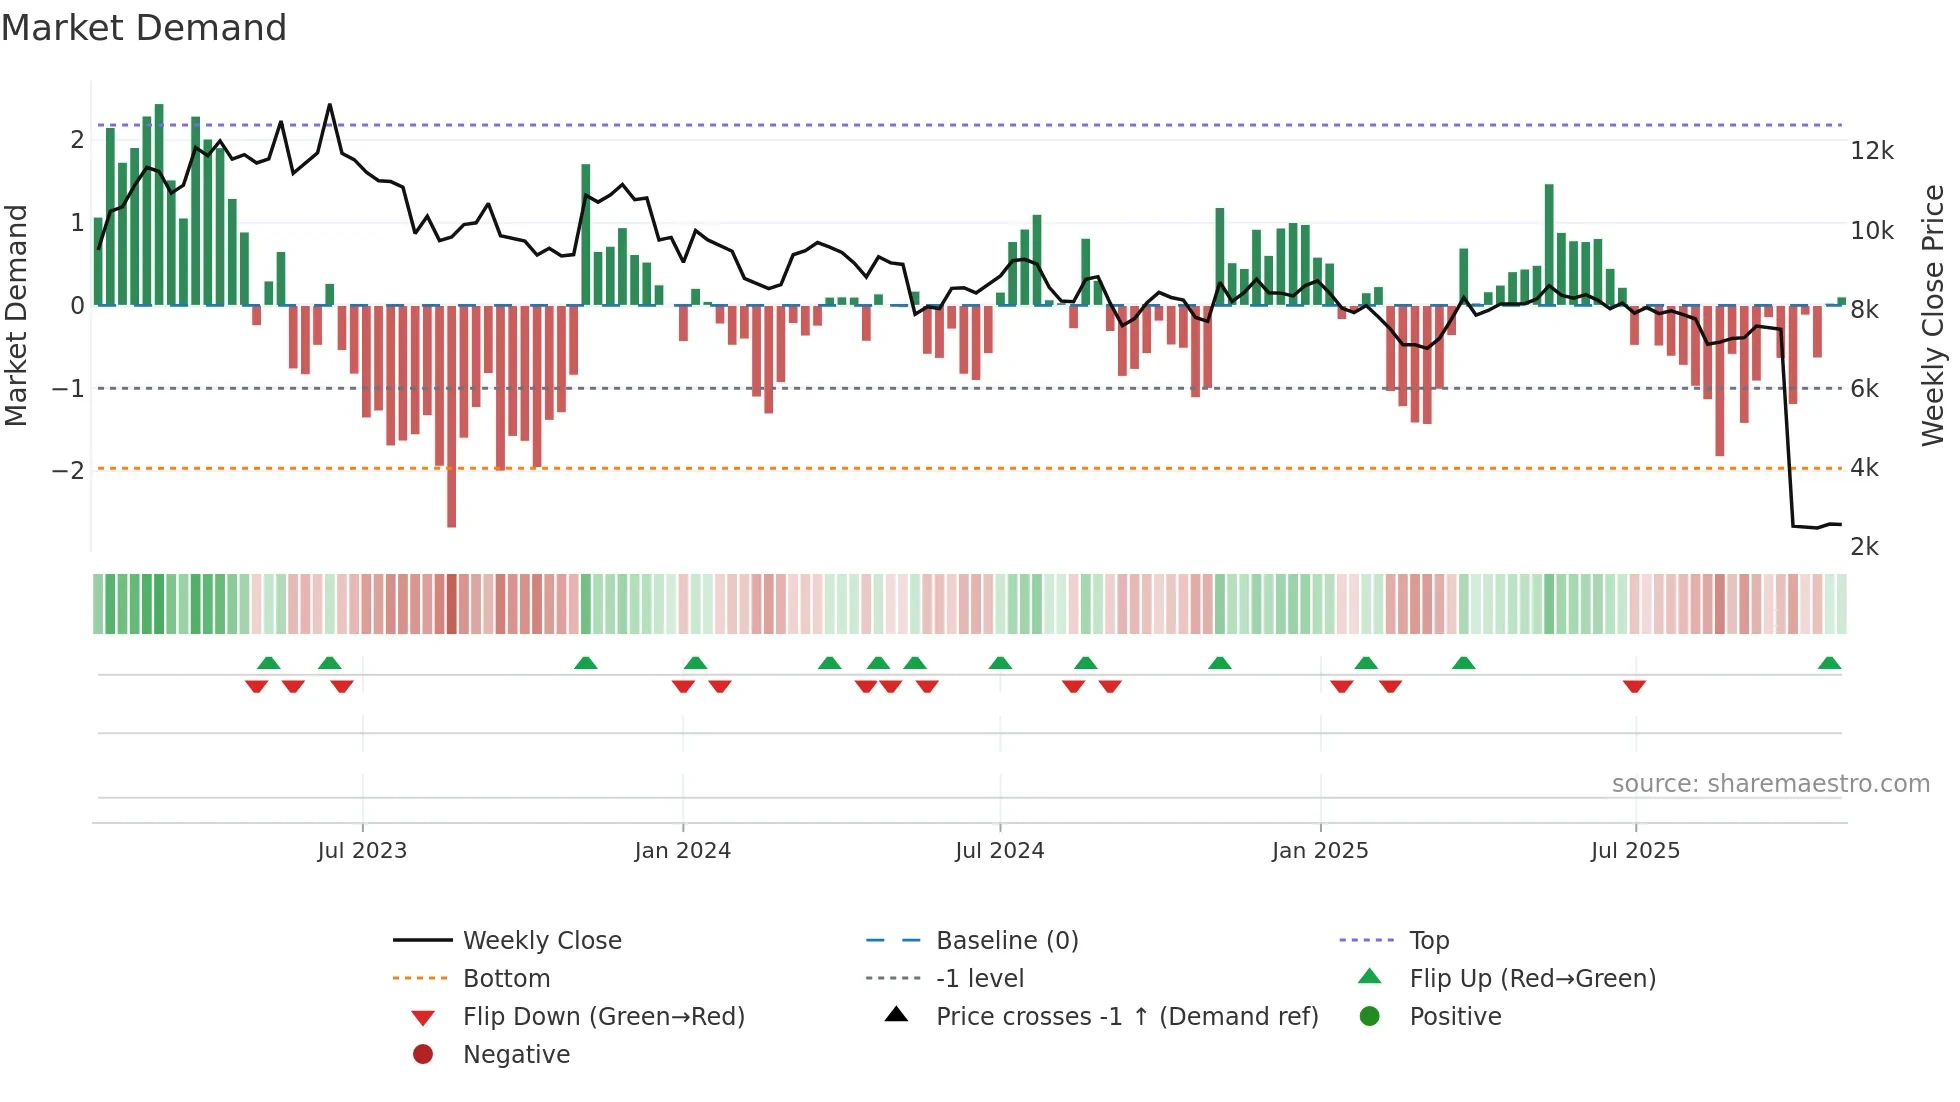
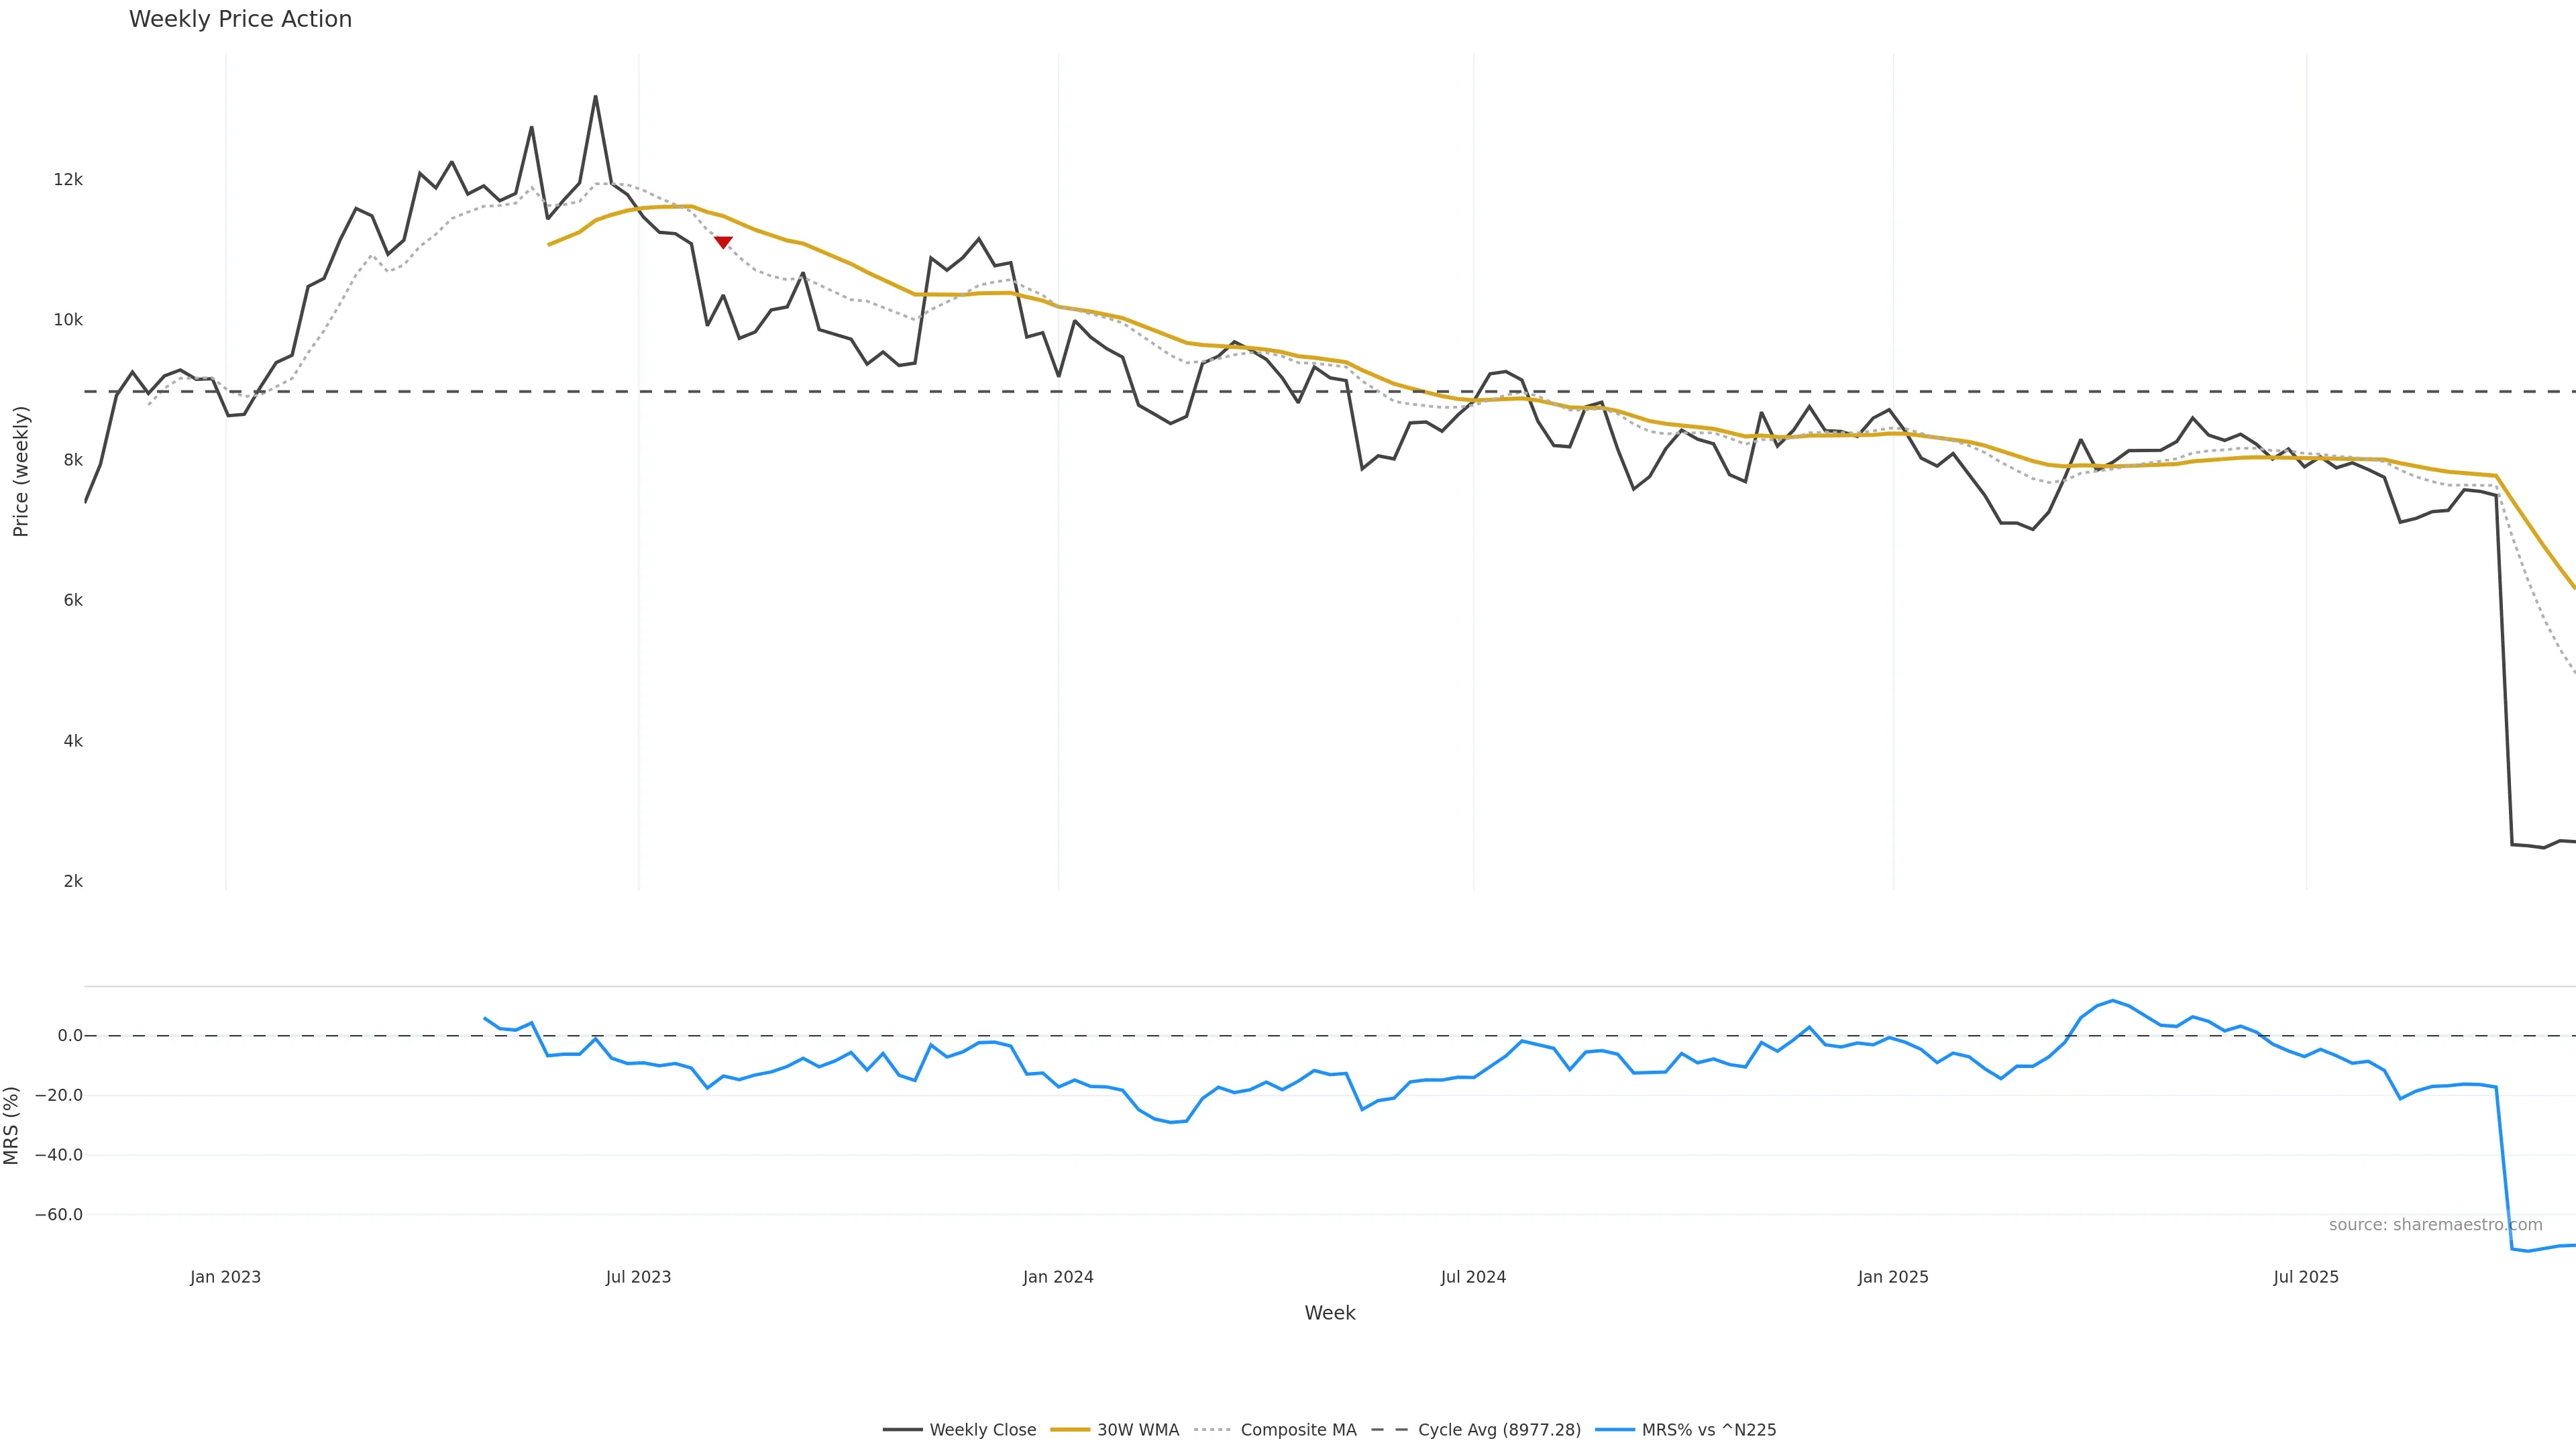
Bullish divergence: price made a lower low while Dynamics made a higher low.
Bullish divergence: price made a lower low while Dynamics made a higher low. Often an early tell for bottoming phases. In essence this reflects state changes, ribbon flips, and early trend anatomy with a bullish tilt.
pol 0.8
conf 0.65
strong · high
What it means
Bullish divergence: price made a lower low while Dynamics made a higher low. Often an early tell for bottoming phases. In essence this reflects state changes, ribbon flips, and early trend anatomy with a bullish tilt.
Implications
Improves odds for follow-through if pullbacks hold higher lows. (pol 0.80, conf 0.65 → strong/high)
Positive
Positive
pol 0.6
conf 0.404
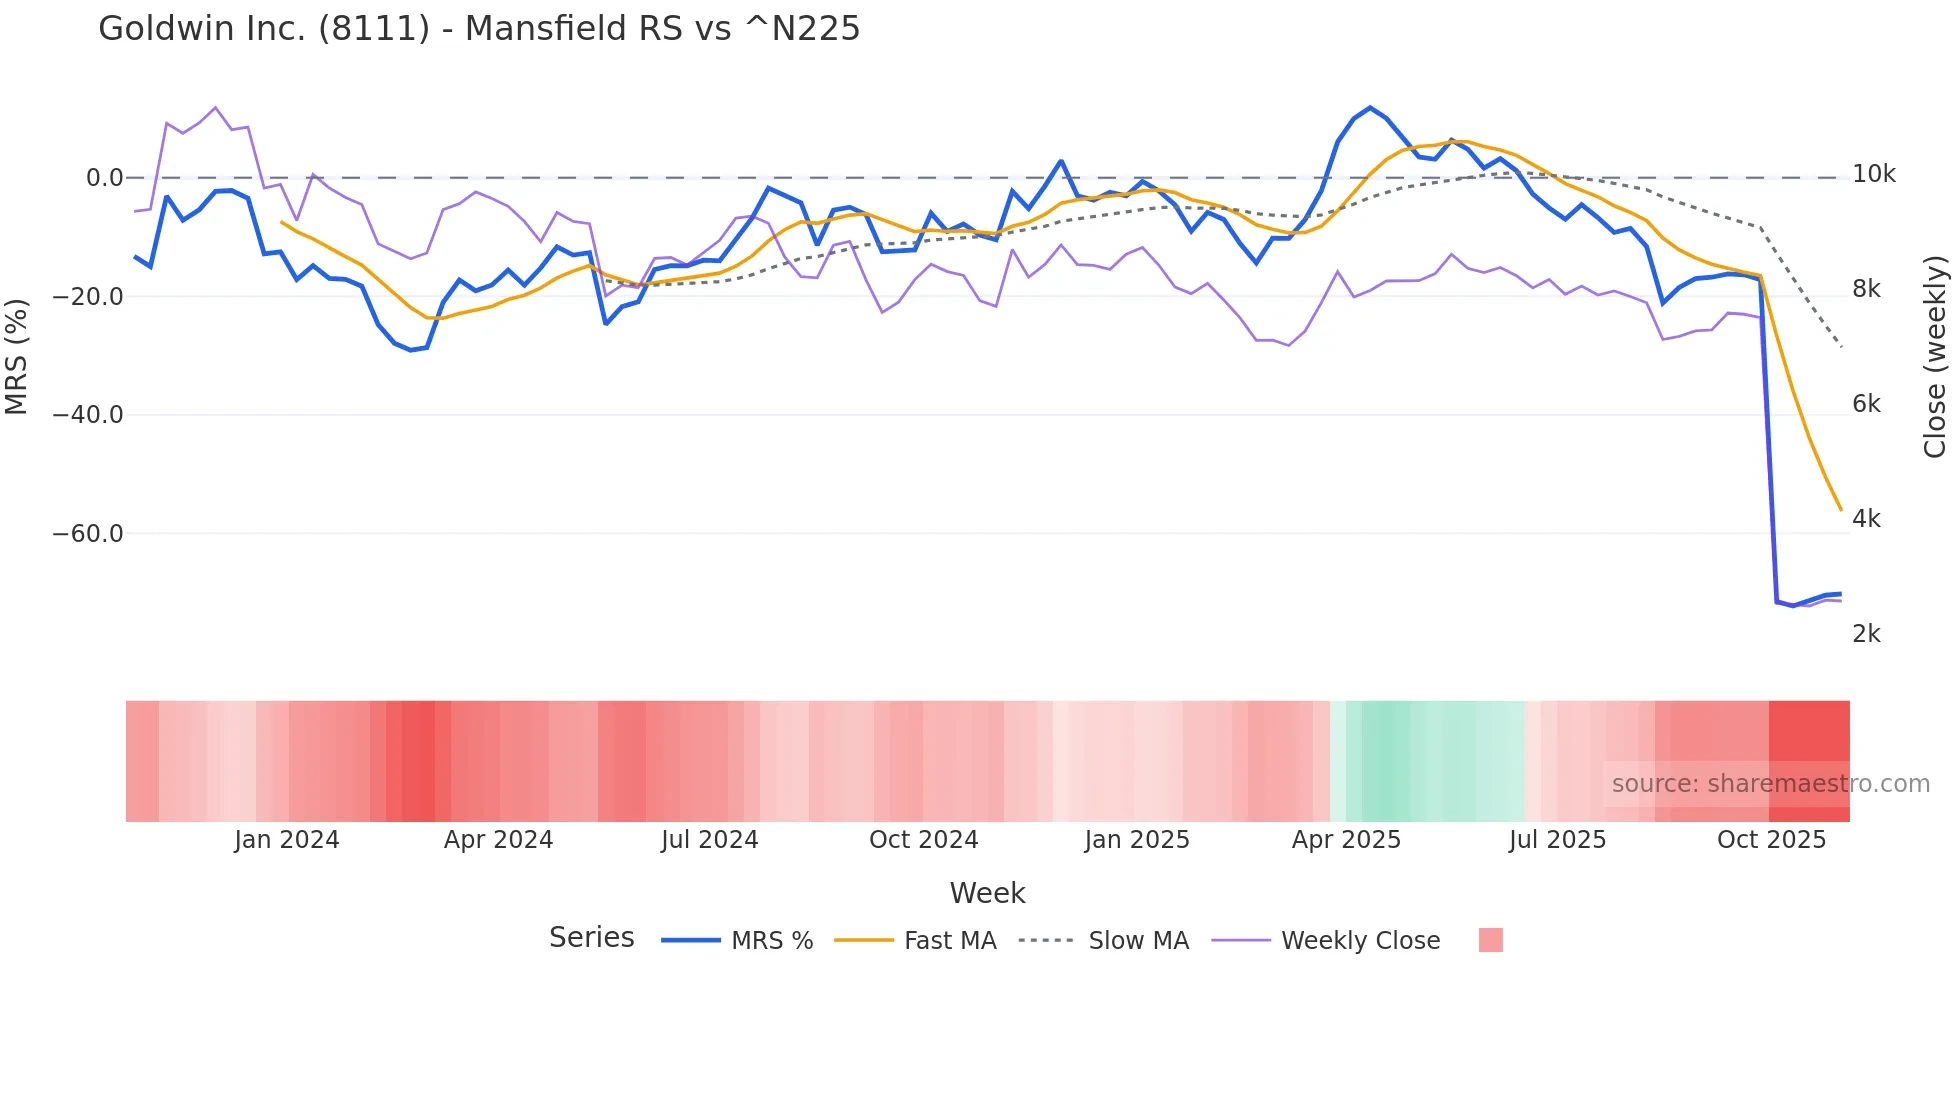
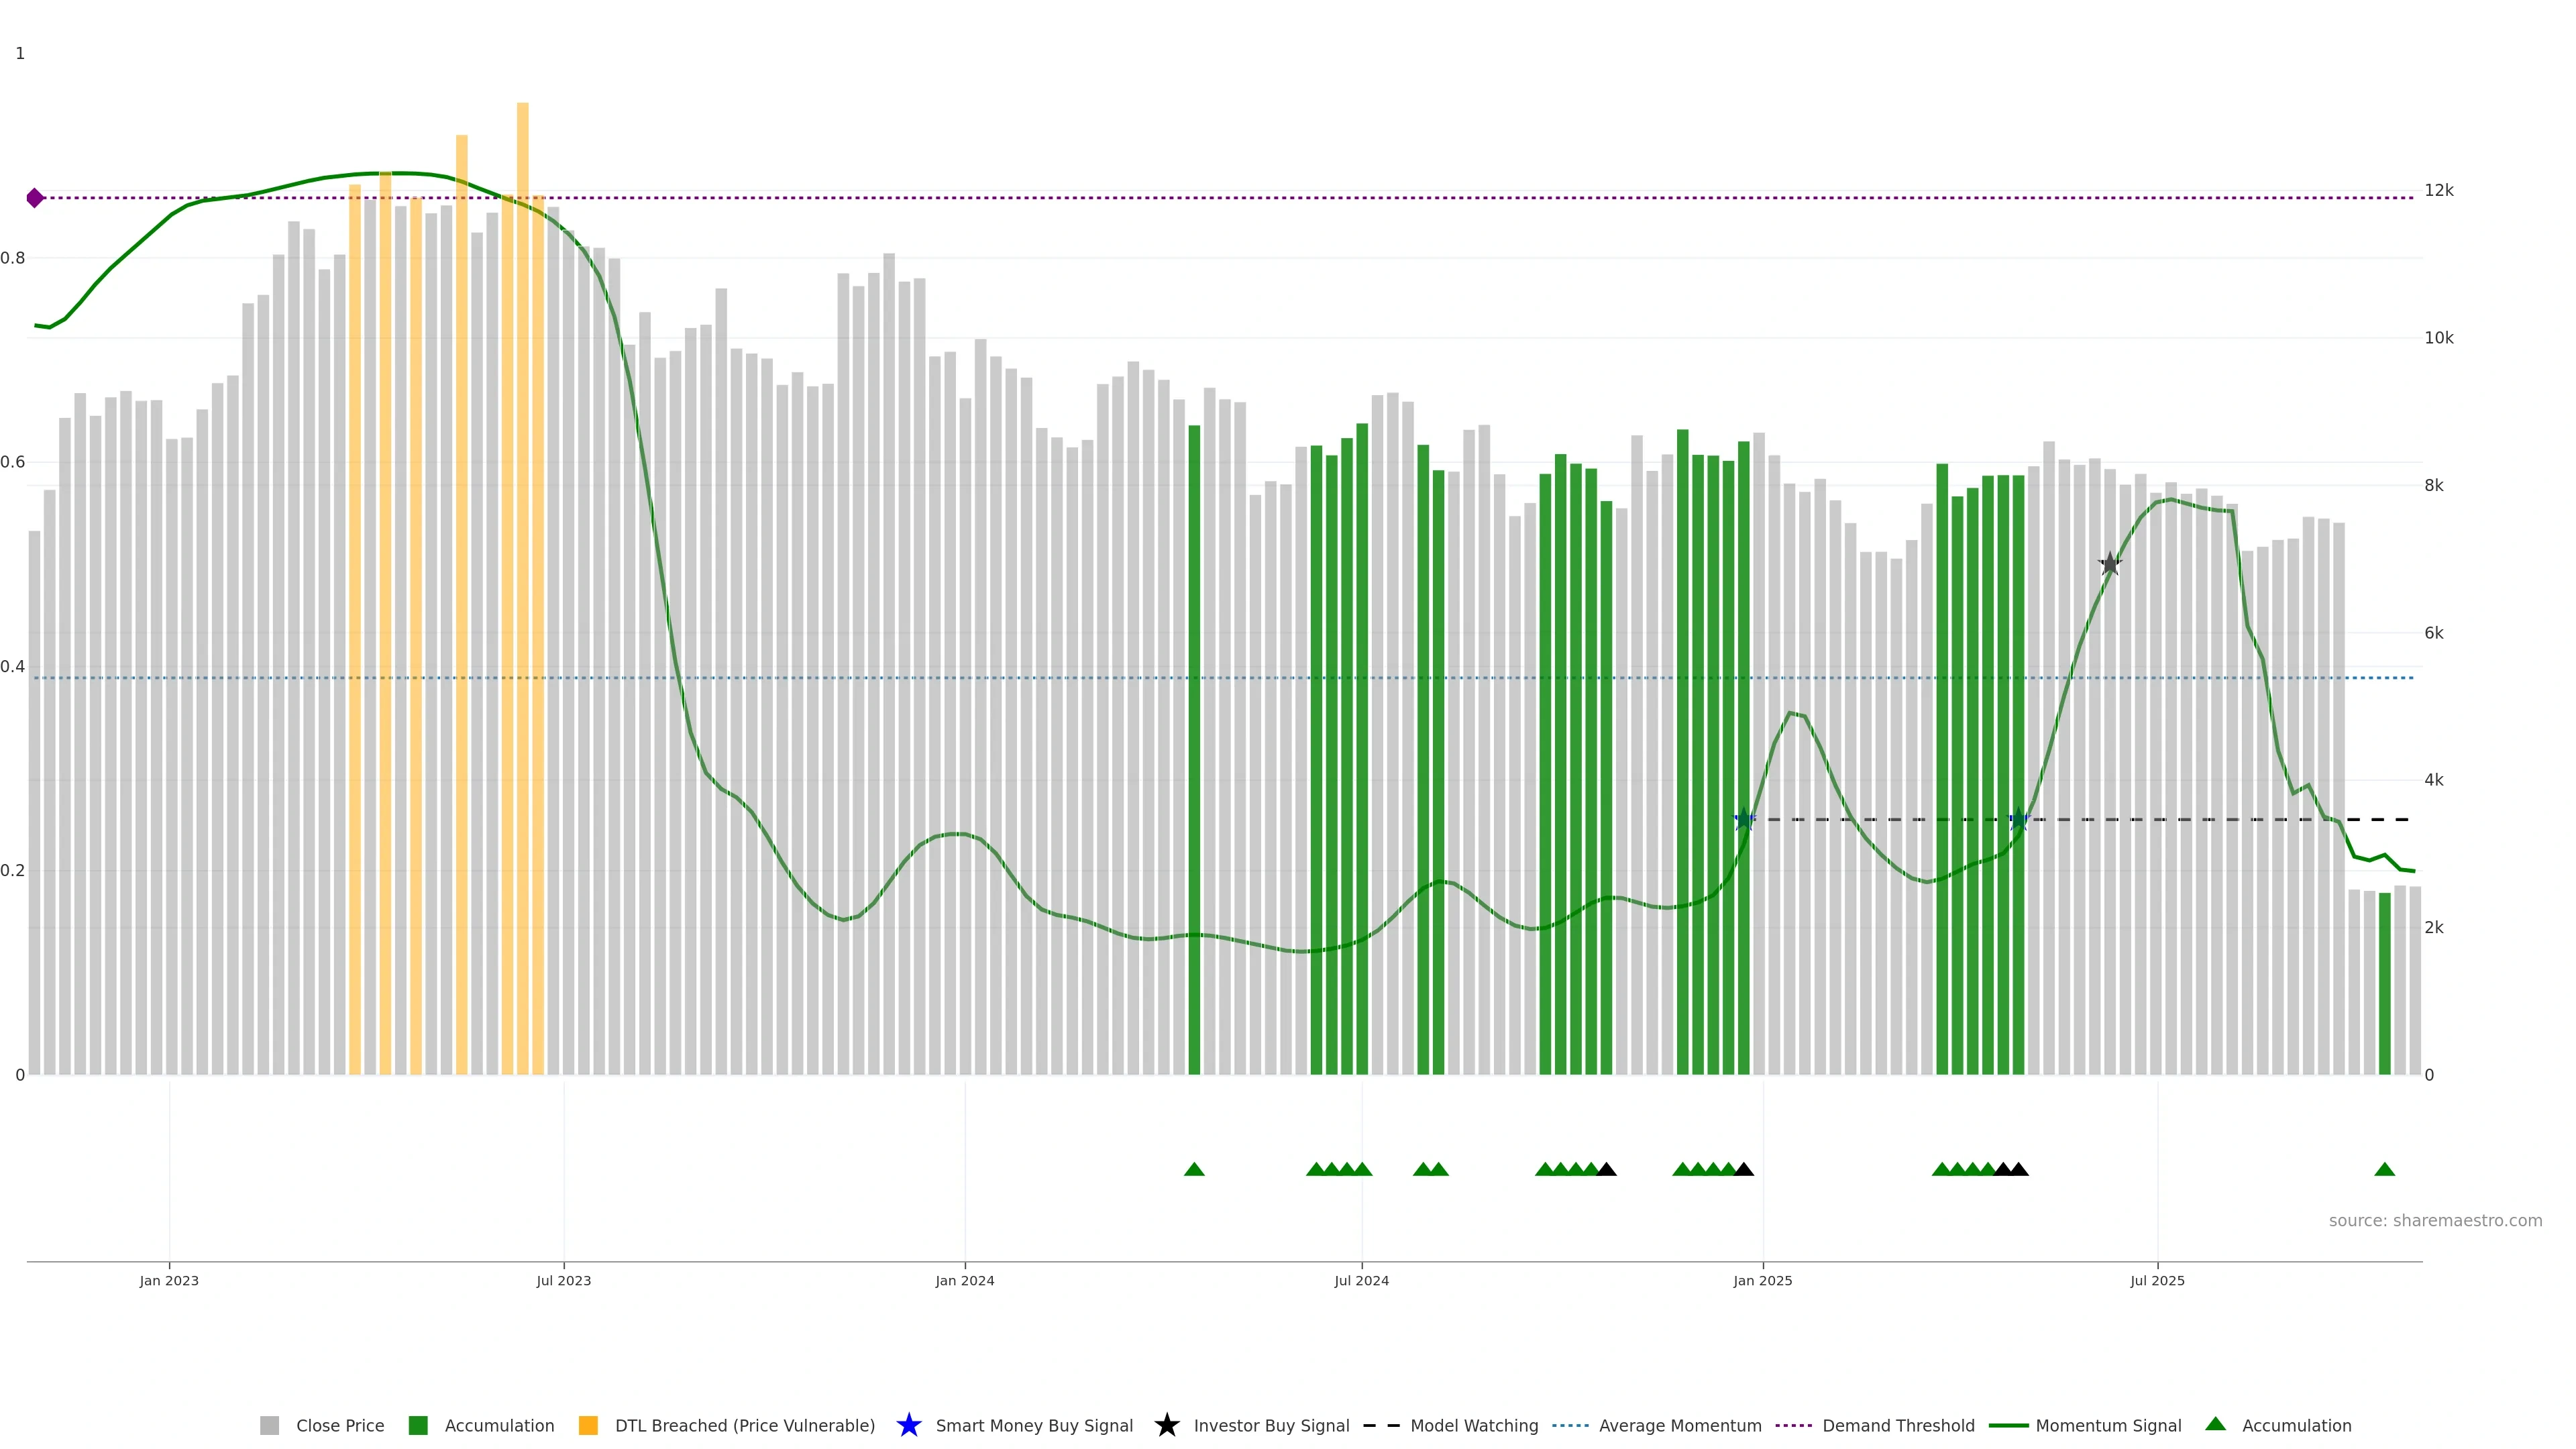
Dynamics turning up from negative territory.
Dynamics turning up from negative territory. Early trend repair often precedes price strength. In essence this reflects state changes, ribbon flips, and early trend anatomy with a bullish tilt.
Implications
Improves odds for follow-through if pullbacks hold higher lows. (pol 0.60, conf 0.40 → strong/medium)